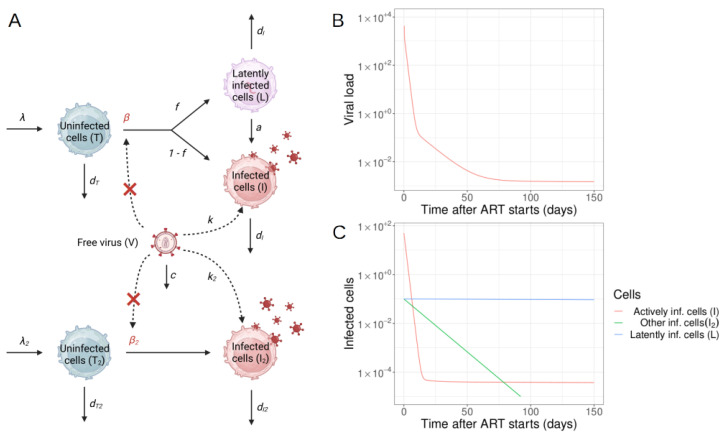
Figure 2.
Schematic of a viral dynamics model involving multiple populations of infected cells. (A) A flow diagram between two populations of uninfected cells (T, T), virus infected cells (I, I), a latently infected cell population (L) and free HIV-1 (V) according to the ODE shown in Equation (4). Red X’es indicate the complete interruption of viral infection during fully effective therapy. (B) The decay of the viral load in multiple stages is shown. (C) The decay of distinct host-cell populations, as predicted by the model, are depicted. Time-series were integrated using JSim v2.21 with standard integration parameters [32]. (Figure adapted from Hill [18] and created by part (A) with BioRender.com).

