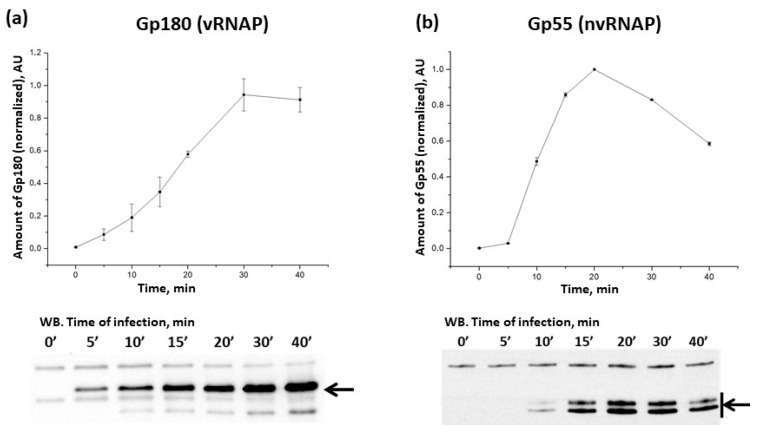
Figure 1.
Accumulation of PhiKZ Gp180 and Gp55 in the course of the infection. Changes in RNAP subunit amounts (determined by the intensity of bands on Western blots such as the ones shown below) are presented. For each time point, means from three independent measurements are plotted; error bars represent standard deviations. Black arrows indicate the positions of Gp180 (a) and Gp55 (b) bands; Gp55 migrates as two bands.

