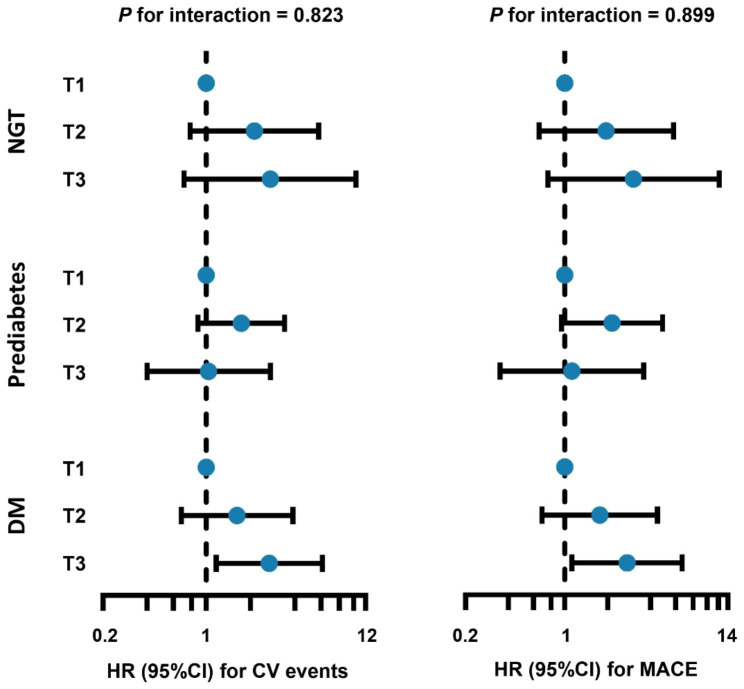
Fig. 3.
Forest plot for the TyG index and CV events or MACE according to different glycemic status. Models adjusted for age, male sex, BMI, hypertension, diabetes mellitus, ACS presentation, MI histories, TC, LDL-C, hsCRP, serum creatinine, LVEF, and three-vessel disease. Blue dots indicate HR value and Bars indicate 95%CIs. CI, confidence intervanl; CV, cardiovascular; DM, diabetes mellitus; HR, hazard ratio; MACE, major adverse cardiac event; NGT, normal glucose tolerance; TyG, triglyceride-glucose

