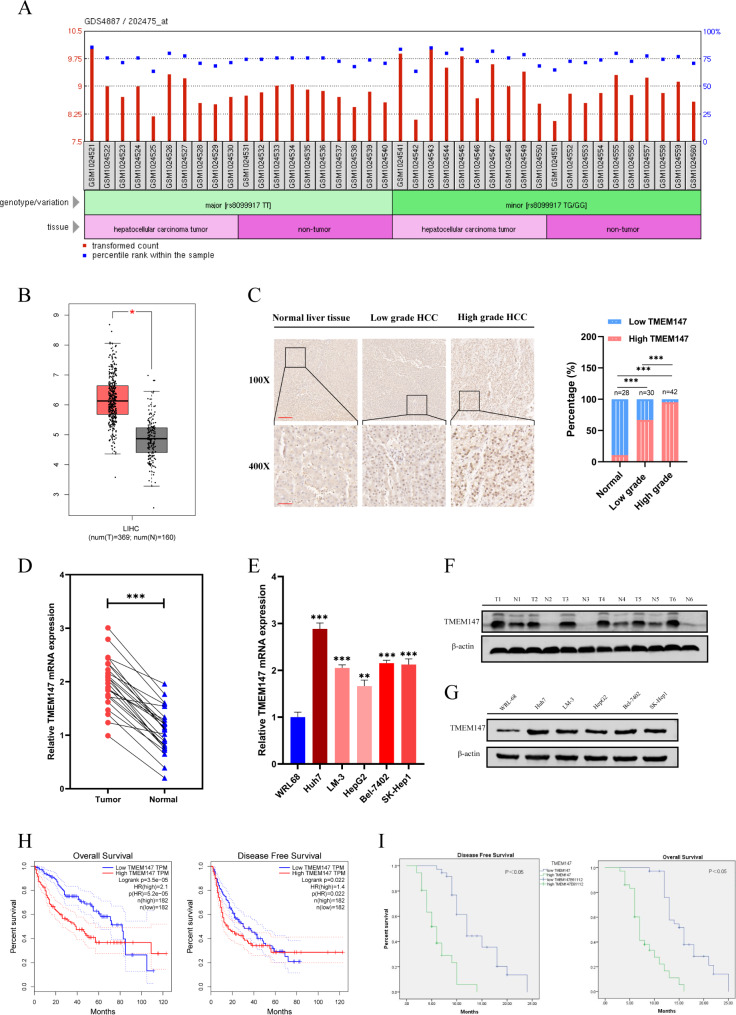
Fig. 1.
TMEM147 was highly expressed in HCC and correlates with poor prognosis in HCC patients. (a) Differential expression of TMEM147 in the GDS4887 dataset. (b) TMEM147 expression levels in HCC (n = 369) and non-tumor tissues (n = 160) in GEPIA database. The differential analysis is based on the selected datasets with TCGA tumors versus TCGA normal + GTEx normal. Data are presented as mean ± SEM. *P < 0.01 (one-way ANOVA). (c) Representative images of TMEM147 IHC staining in normal liver tissues, high grade HCC and low-grade HCC tissues, and percentage of patients with HCC histological differentiation. Scale bars, × 100: 200 μm; × 400: 50 μm. (d) TMEM147 mRNA levels in HCC tissues and adjacent non-tumorous tissues. (e) qRT-PCR analysis of TMEM147 expression in HCC cell lines. (f) Western blot analysis of TMEM147 expression in HCC and matched non-tumor tissues. (g) TMEM147 protein levels in HCC cell lines and relative band density. (h) Kaplan–Meier overall survival and disease-free survival curves of patients with HCC with high (n = 182) and low (n = 182) expressions (stratified by median) of TMEM147 mRNAs in the GEPIA database using TCGA data (log-rank test). (i) Kaplan–Meier survival analysis of patients with HCC according to TMEM147 expression. All bar graphs are plotted as mean ± SEM of three independent experiments performed in triplicate. *P < 0.05, **P < 0.01, ***P < 0.001

