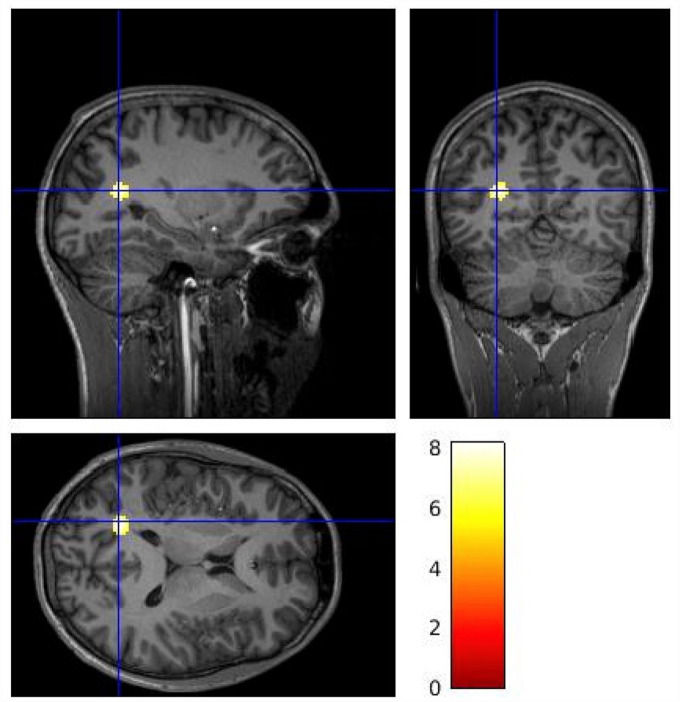
Figure 3.
Voxel-wise analysis [11C]MK-8278 VT brain images identifying lower tracer binding in patients compared to controls (control > patient contrast). The gradient heat bar indicates T contrast from a voxel-wise two sample t-test. The cluster included voxels within the left cuneus (peak MNI coordinates x = −20, y = −62, z = 16, pFWE corr = 0.01).

