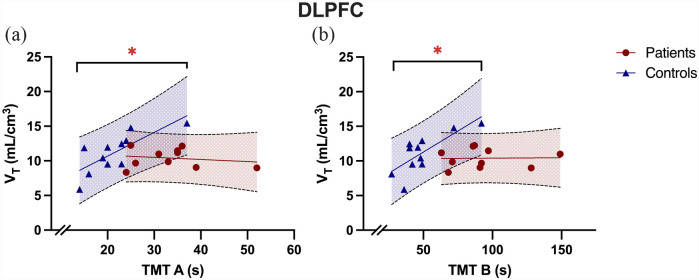
Figure 4.
Tracer uptake in dorsolateral prefrontal cortex (DLPFC) correlated with TMT performance in controls but not patients. (a) The image shows DLPFC VT correlated with TMT A performance in controls (r = 0.77, p = 0.01) but not in patients (r = −0.18, p = 0.62; r dif = 0.95, z = 2.30, 95% CI = 0.18–0.98, p = 0.02 ), while (b) shows DLPFC VT correlated with TMT B performance in controls (rho = 0.74, p = 0.01) but not in patients (rho = −0.06, p = 0.81; r dif = 0.79, z = 1.92, 95% CI = −0.02–0.97, p = 0.06).
s, seconds; VT, volume of distribution.
*p < 0.05.

