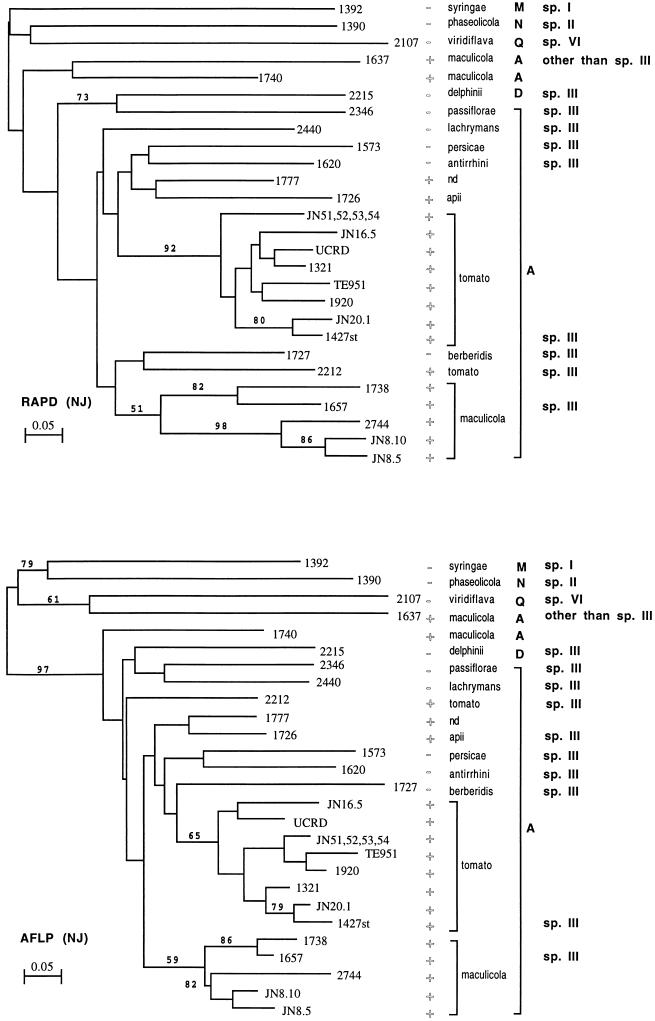
FIG. 2.
Dendrograms showing the genetic relatedness of P. syringae and P. viridiflava strains based on RAPD and AFLP analyses. The trees were constructed by the neighbor-joining (NJ) method. A, D, M, N, and Q indicate genomic groups determined by PCR-RFLP analysis of the rrn operon (12), and sp. I, sp. II, sp. III, and sp. VI indicate the genomic species determined by DNA-DNA hybridization (18). The scale indicates the amount of difference. The numbers on the branches indicate the bootstrap percentage at each node. +, strain pathogenic on tomato; −, strain not pathogenic on tomato.

