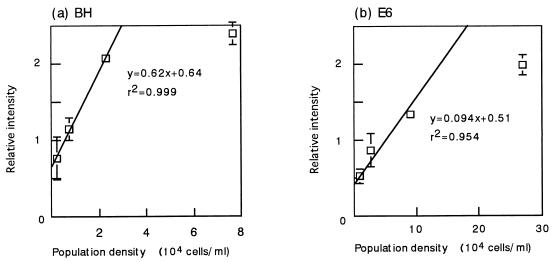
FIG. 2.
Standard curves for determining the densities of BH and E6 populations in laboratory unit sludge. A quantitative PCR was carried out as described in the legend to Fig. 1, except that a DNA quantity standard was used to compare the results obtained in different gels. The ordinate indicates the intensity of the band of each PCR product relative to the intensity of the DNA quantity standard. The means of three determinations are shown, and the error bars indicate standard deviations.

