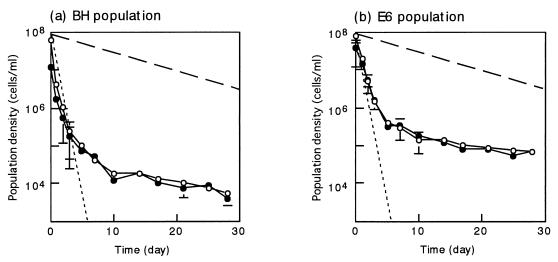
FIG. 4.
Dynamics of the BH (a) and E6 (b) populations introduced into phenol-digesting activated sludge under stable operational conditions at a phenol-loading rate of 0.4 g per liter per day. Symbols: ○, population density in total activated sludge; •, population density in activated-sludge flocs (per milliliter of liquid in the aeration tank); dashed line, theoretical washout curve at a Tr of 10 days; dotted line, theoretical washout curve at a Tr of 0.5 day. The theoretical curves were drawn by using the following equation: St = S0 · exp[−t/Tr], where St is the population density at time t and S0 is the initial population density. The means of three determinations are shown, and the error bars indicate standard deviations.

