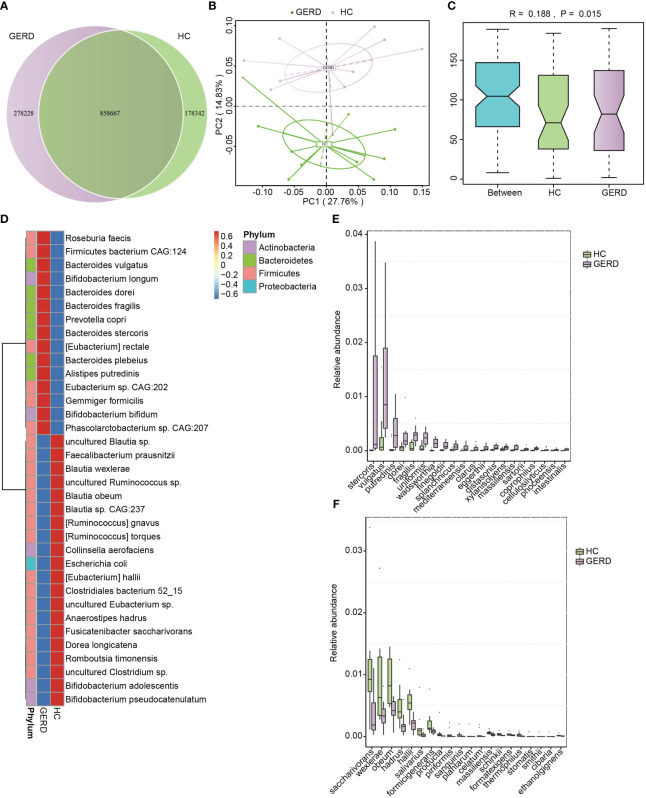
Figure 2.
Gut microbiota differences based on metagenomic sequencing. (A) Venn diagram; (B) PCoA based on the Bray–Curtis distance; (C) ANOSIM analysis based on species abundance, Between represents the difference between groups; others are within groups; (D) Clustering heatmaps of the differentially enriched bacterial species between the groups; (E, F) The top 20 microbes with significant differences in abundance at the species level.

