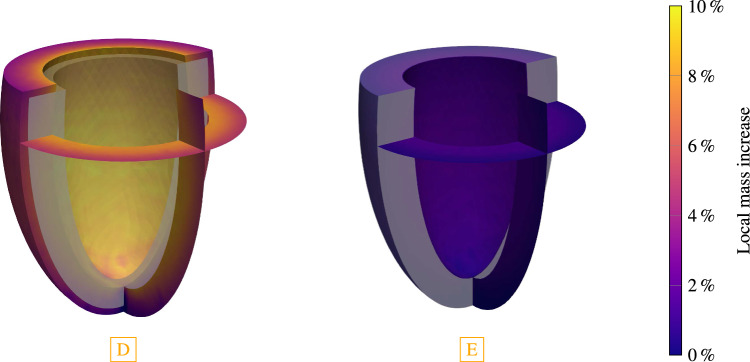
Fig. 9.
The final configuration of each G&R phase of the simulated stage 1 hypertension. The reference configuration is depicted in gray. Configuration D has recovered homeostasis for an increased pressure of (stage 1 hypertension). The cavity volume of the ventricle increased and a slightly more spherical shape is observed. Configuration E has recovered homeostasis after returning to baseline pressure . An almost complete reversal of the growth is observed resulting in only a small deviation from the reference configuration

