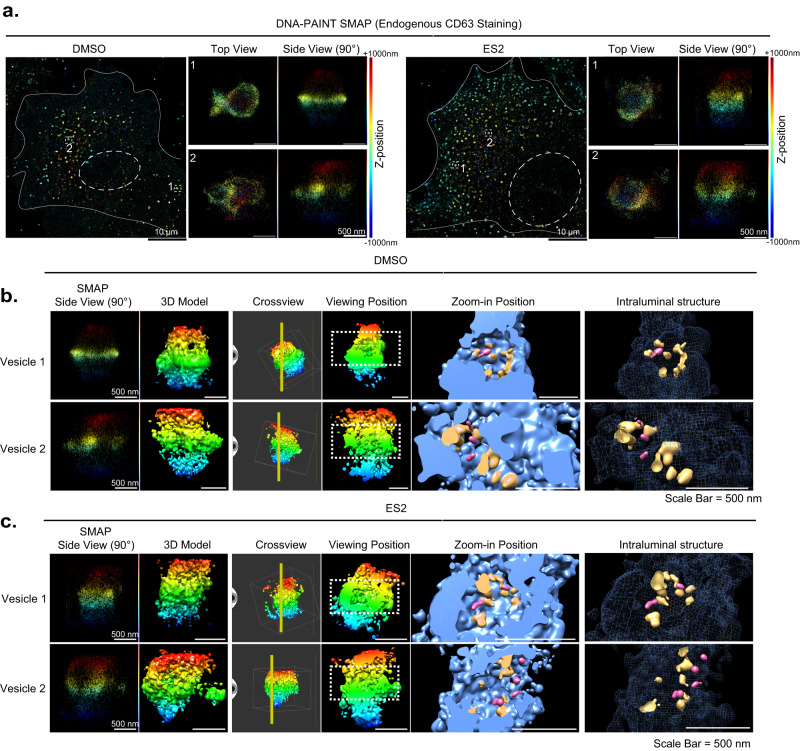
Fig. 3. Super-resolution imaging of MVEs by DNA-PAINT.
a 3D DNA-PAINT images of COS-7 cells treated with DMSO (left panels) or ES2 (right panels). The relative z-positions of the localizations within the ~2 µm axial range (effective imaging range is ~1.5 µm) are color-coded as indicated. The white dashed rectangles mark the CD63-positive vesicles (zoomed in) and are shown as viewed from the apical side of the cells (top view) or from an angle perpendicular to the bottom membrane (side view). b, c Volumetric renderings of the CD63-positive vesicles shown in (a) from DMSO-treated (b) and ES2-treated (c) cells. The 3D localizations are converted into molmaps using UCSF Chimera with a sigma factor of 1.5, which results in a final rendering resolution of ~24 nm. Left-most columns are side views from SMAP, each paired with a corresponding 3D structural model from Chimera (2nd columns). The vertical yellow line in “Crossview” panel (third columns) corresponds to the cutting plane for the subsequent cross-section views (columns four, five, and six), all shown as viewed from the left of the cutting plane. White boxes in the cross views indicate the outer bounds of SMAP localizations, while the dotted white rectangles in the viewing position (fourth columns) indicate the border of the zoom-in views, shown as filled volumes (fifth columns) or wireframes (sixth columns). Within both zoom-in views, pink-colored structures indicate intraluminal vesicles, which correspond to densities within the interior cavity that are detached from the enclosing lumen. The orange-colored structures indicate potential invaginations that are budding off and still connected to the enclosing MVE membrane. Scale bars = 10 µm (white, as in overviews) or 500 nm (white, as in close-up views). All experiments were repeated more than three times in (a, b and c).

