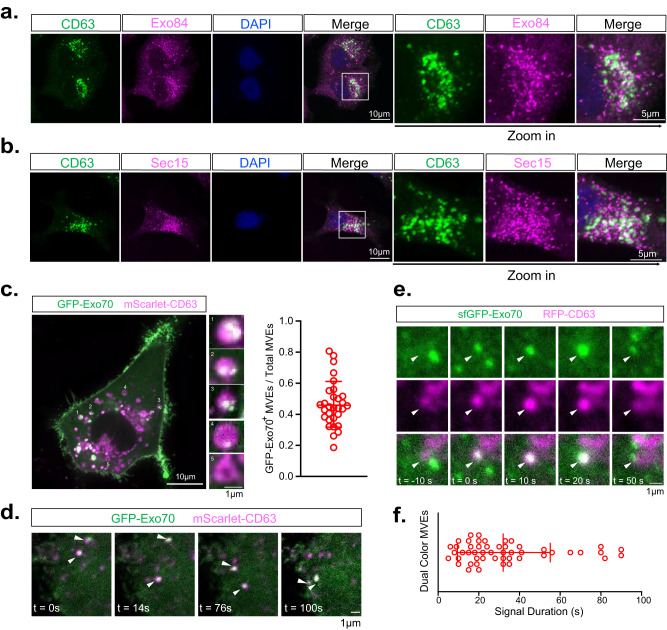
Fig. 4. The exocyst is associated with a subpopulation of MVEs.
a, b Immunostaining of CD63 and Exo84 (a) and CD63 and Sec15 (b) in MDA-MB-231 cells. Scale bar = 10 µm (overview) or 5 µm (zoom-in view). (n = 12 cells) and quantification is presented in Supplementary Fig. 4. c Confocal imaging of mScarlet-CD63+ and GFP-Exo70+ vesicles. Five representative CD63+ vesicles are enlarged in small panels. Quantification of the portion of mScarlet-CD63+ GFP-Exo70+ vesicles in total mScarlet-CD63+ vesicles is shown at right (n = 30 cells). Data are presented as mean ± s.d. Scale bar = 10 µm (overview) or 1 µm (zoom-in view). d Time-lapse confocal imaging of mScarlet-CD63+ and GFP-Exo70+ vesicles (arrowhead) moving toward the plasma membrane. Scale bar = 1 μm. e TIRF microscopy imaging of an RFP-CD63+ and sfGFP-Exo70+ vesicle (arrowhead) during its arrival at the plasma membrane. Scale bar = 1 μm. Scale bar = 1 μm. f Quantification of the duration of the RFP-CD63+ and sfGFP-Exo70+ vesicle at the plasma membrane in (e) (n = 50 vesicles). Data are presented as mean ± s.d.

