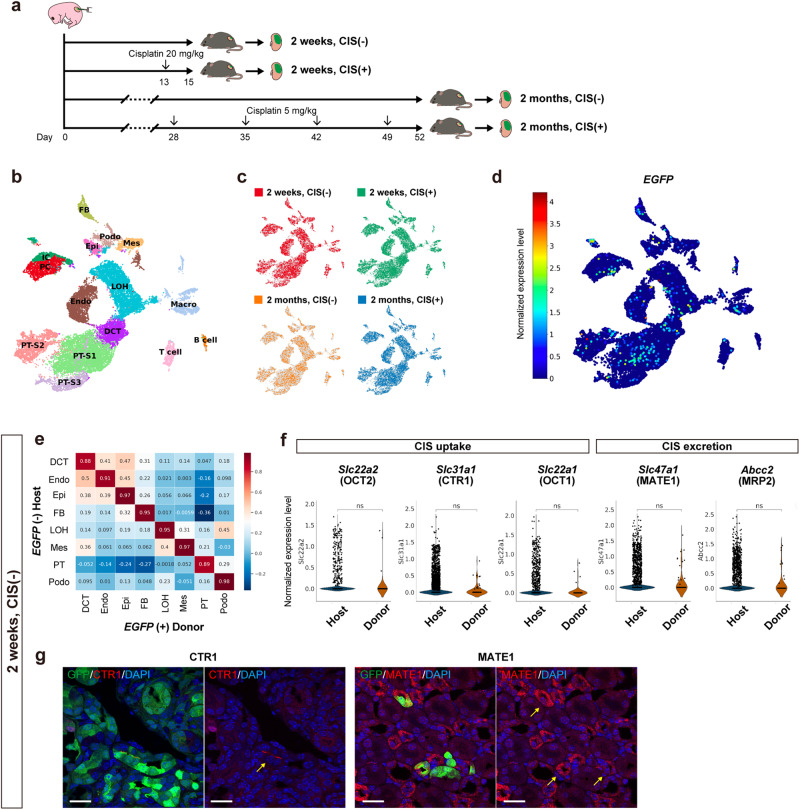
Fig. 3. Maturation of exogenous nephrons (EGFP+) comparable with host nephrons (EGFP − ) evaluated with single-cell RNA-sequencing (scRNA-seq).
a A schematic of the sample collection. b Uniform manifold approximation and projection (UMAP) displaying unsupervised clustering of all 24,682 cells into 15 distinct, with annotation based on the expressions of previously reported marker genes. c Distribution of the four samples in the UMAP. d Distribution of EGFP (+) donor cells in the UMAP. The color scale indicates log-normalized EGFP expressions in each cell. e Pearson correlation analysis of the 2 weeks, CIS (−) sample, illustrating the correlation between host (EGFP −, n = 6141 cells) and donor (EGFP +, n = 64 cells) cells regarding the expression patterns of each cell type. f Violin plots depicting normalized expression levels of transporters involved in CIS uptake (Slc22a2, Slc31a1, and Slc22a1) and excretion (Slc47a1 and Abcc2) in host (n = 1291 cells) and donor (n = 20 cells) proximal tubule cells of the 2 weeks, CIS (−) sample. Data were analyzed using Welch’s t-test. g Immunostaining displaying the expressions of CTR1 and MATE1 in chimeric nephrons, indicated by yellow arrows. Scale bars, 20 μm in (g). CIS, cisplatin; DAPI, 4’,6-diamidino-2-phenylindole; DCT, distal convoluted tubule; EGFP, enhanced green fluorescent protein; Endo, endothelial cell; Epi, epithelial cell; FB, fibroblast; GFP, green fluorescent protein; IC, collecting duct intercalated cell; LOH, loop of Henle; Macro, macrophage; Mes, mesangial cell; NK, natural killer cell, ns, not significant; PC, collecting duct principal cell; Podo, podocyte; PT, proximal tubule; PT-S1 ~ 3, PT-segments 1–3; RBC, red blood cell.

