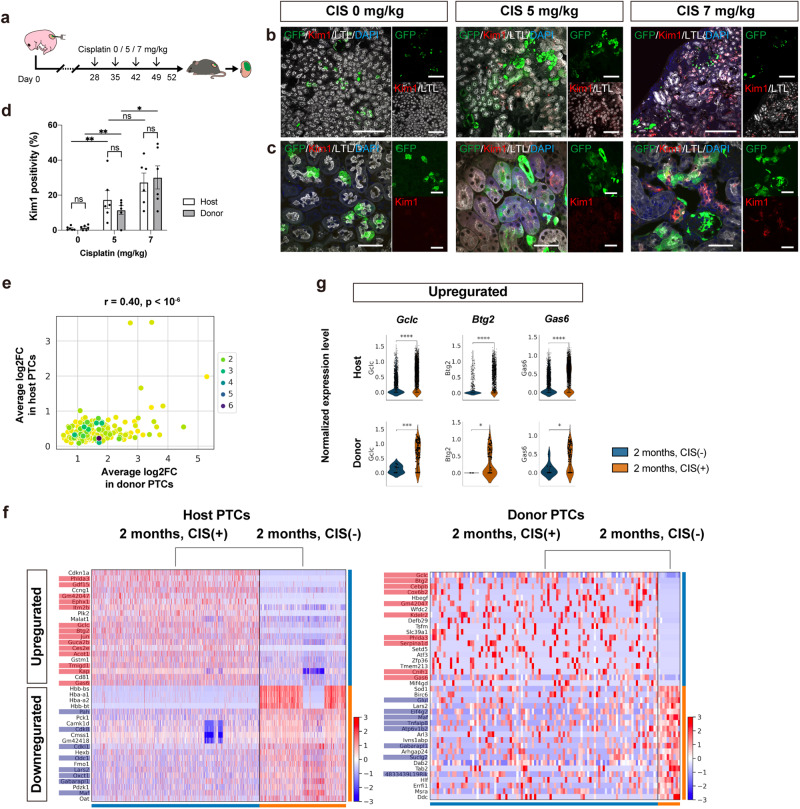
Fig. 6. Application of chimeric nephrons in repeated-dose testing.
a A schematic of the repeated-dose testing of CIS. b, c Immunostaining demonstrating that the expression level of Kim1 in proximal tubule cells (PTCs, LTL+) of the host (GFP−) and donor (GFP+) origin increases in a dose-dependent manner with CIS treatment. d Kim1 positivity of host and donor PTCs after CIS treatment (n = 6 sections from 3 biologically independent samples). Error bars represent means ± SEM. Data were analyzed using the two-tailed unpaired t-test. ns, not significant. *p < 0.05; **p < 0.01. e–g Comparison between the samples at 2 months, CIS (−) and 2 months, CIS (+) (Fig. 3a) for both host and donor PTCs. e A comparison of the extent of individual gene expression changes upon repeated CIS administration, shown by log2 fold change (log2FC), between host PTCs (n = 1829 cells in 2 months, CIS (−) vs. n = 3559 cells in 2 months, CIS (+)) and donor PTCs (n = 10 cells in 2 months, CIS (−) vs. n = 103 cells in 2 months, CIS (+)). f Heatmaps displaying genes with high variability, both up- and downregulated upon CIS administration, in host and donor PTCs. Genes with significant expression changes (log2FC > 1 and p < 0.05) in both host and donor PTCs are highlighted in red (upregulated) and blue (downregulated). g Violin plots showing normalized expression levels of representative variable genes in host and donor PTCs without (blue) and with (orange) CIS treatment. Scale bars, 200 μm (b) and 50 μm in (c). CIS, cisplatin; DAPI, 4’,6-diamidino-2-phenylindole; GFP, green fluorescent protein; LTL, lotus tetragonolobus lectin; Kim1, kidney injury molecule 1.

