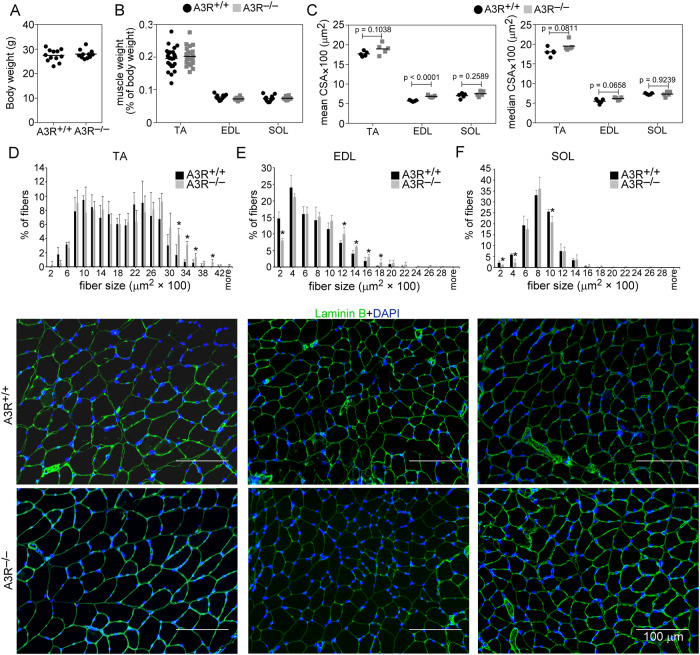
Fig. 1. Phenotypic characteristics of TA, EDL, and SOL muscles in wild-type and A3R−/− mice.
A Body weight and B muscle weight/body weight ratios in A3R+/+ and A3R−/− mice. C Mean and median myofiber cross‐sectional area (CSA) of the TA, EDL, and SOL muscles in A3R+/+ and A3R−/− untreated mice. Data are expressed as mean and individual values, and statistical significance was determined by two-tailed Student’s t-test (n = at least 4 samples). Myofiber size repartition in D TA, E EDL, and F SOL control muscles of A3R+/+ and A3R−/− mice with their representative immunofluorescence pictures of laminin (green) and DAPI (blue) nuclear staining. ImageJ software was used to examine 500 or more myofibers in each sample. Scale bars, 100 μm. Mean values ± SD are shown, and statistical significance was determined by two-tailed Student’s t-test. *p < 0.05. (n = 4 samples).

