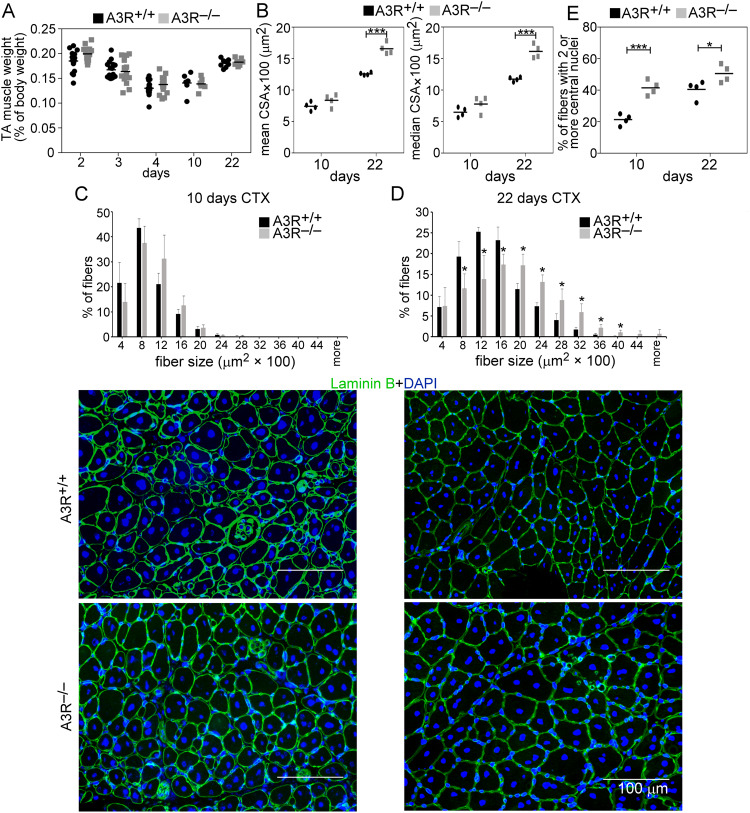
Fig. 4. Increased muscle fiber size in the regenerating muscles of A3R−/− mice.
A Muscle/body weights, B mean and median myofiber cross-sectional areas (CSA), and C, D distribution of myofiber sizes in TA muscles of A3R+/+ and A3R−/− mice at day 10 and 22 post-CTX–induced injury together with their representative immunofluorescence images of laminin (green) and DAPI (blue) nuclear staining. Scale bars, 100 µm. 500 or more myofibers were analyzed in each sample using ImageJ software. Data are expressed as mean or median ± SD. E Percentage of newly formed myofibers containing two or more central nuclei in TA muscles of A3R+/+ and A3R−/− mice at day 10 and 22 post-CTX–induced injury. Data are expressed as mean or median and individual values in panels (A, B, and E) (n = at least 15 samples in panel (A) and n = 4 on panels (B and E)), while as mean ± SD (n = 4) in panels (C and D). Statistical significance was determined by two-tailed Student’s t-test. *p < 0.05, ***p < 0.001.

