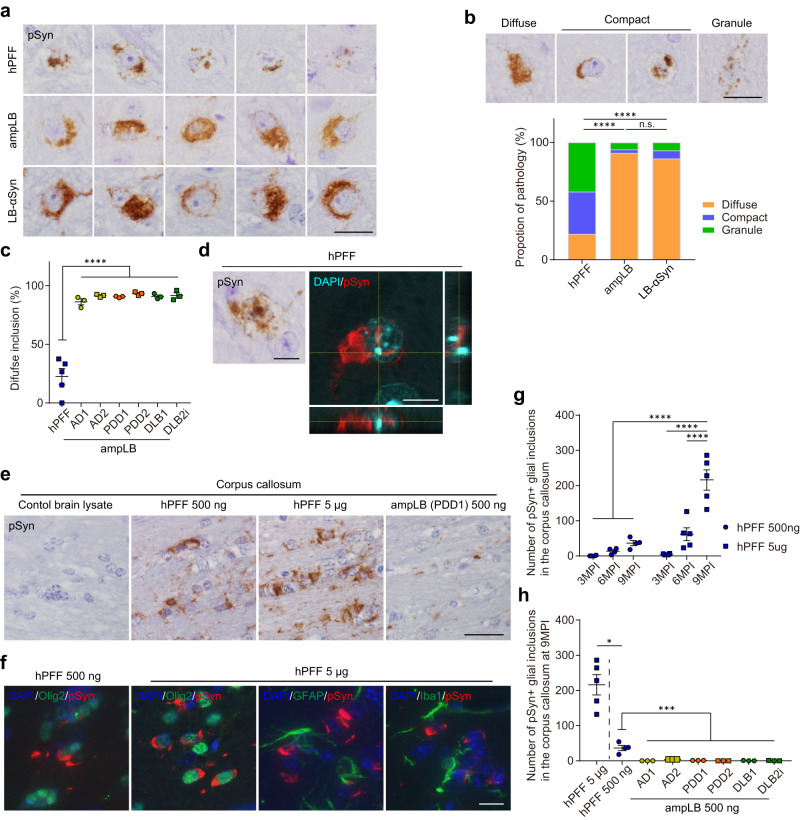
Fig. 3. Differences in morphology of neuronal inclusions and cell-type preference between hPFF and ampLB in WT mice.
a High-magnification image of pSyn-positive neuronal inclusions in the SN of hPFF-, ampLB-, and LB-αSyn-injected mice at 6MPI. Images are representative of 9, 18, and 7 biologically independent samples, respectively. Scale bar 20 µm. b Upper panels: Representative images of diffuse, compact, and granular pSyn-positive inclusions. Lower panels: Comparison of the proportions of diffuse, compact, and granular inclusions (hPFF, n = 50 from 9 biologically independent samples; ampLB, n = 959 from 18 biologically independent samples; LB-αSyn, n = 29 from 7 biologically independent samples). Neuronal inclusions with visible nuclei were evaluated. A two-sided Fisher’s exact test was performed between two groups for differences in the percentages of diffuse and non-diffuse inclusions (hPFF vs. ampLB, LB-αSyn p < 0.0001). Scale bar 20 µm. c Percent of diffuse inclusions in hPFF- and ampLB-injected mice (hPFF n = 5; AD1, AD2, PDD1, PDD2, DLB1, DLB2i, n = 3 biologically independent samples). One-way ANOVA with a Tukey’s post hoc test was performed (hPFF vs. AD1, AD2, PDD1, PDD2, DLB1, DLB2i p < 0.0001). d Immunohistochemistry and z-stack confocal microscopy images showing pSyn-positive intranuclear inclusions in hPFF-injected mice. Images are representative of two independent experiments. Scale bars 10 µm. e Immunohistochemistry with a pSyn antibody (EP1536Y) in the corpus callosum at 9MPI. Scale bar 20 µm. f Double immunofluorescence for Olig2 (green) and pSyn (81 A, red), GFAP (green) and pSyn (EP1536Y, red), and Iba1 (green) and pSyn (81 A, red). Scale bar 10 µm. g Number of pSyn-positive oligodendroglial inclusions in the corpus callosum (hPFF 500 ng, n = 4; hPFF 5 µg, n = 4, 5, 5 biologically independent samples). Two-way ANOVA with Sidak’s post hoc test was performed (interaction p = 0.0001, hPFF 500 ng 3, 6, 9MPI, hPFF 5 µg 3, 6MPI vs. hPFF 5 µg 9MPI p < 0.0001). h Number of pSyn-positive oligodendroglial inclusions in the corpus callosum at 9MPI (hPFF 5 µg, n = 5; hPFF 500 ng, n = 4; AD1, AD2, PDD1, PDD2, DLB1, DLB2i, n = 3 biologically independent samples). A two-tailed Mann–Whitney test was performed (hPFF 5 µg vs. hPFF 500 ng p = 0.0159). One-way ANOVA with a Tukey’s post hoc test was performed (hPFF 500 ng vs. AD1, PDD1, PDD2, DLB1, DLB2i p < 0.0001; hPFF 500 ng vs. AD2 p = 0.0002). Data are represented as mean ± SEM. Source data are provided as a Source Data file.

