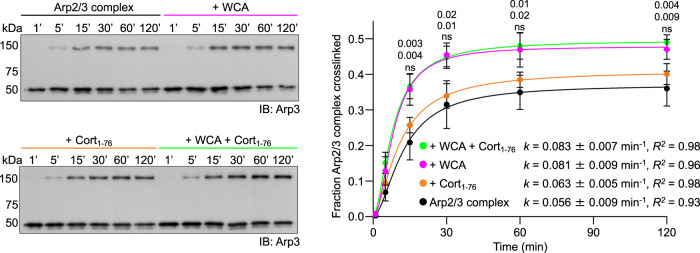
Fig. 2. Effect of Cort1-76 and N-WASP WCA on the short-pitch transition of Arp2/3 complex.
Western blot analysis (Arp3 antibody, left) and densitometric quantification (n = 3, right) of the cross-linked fraction of Arp2/3 complex alone (black) or with WCA (magenta), Cort1-76 (orange), or WCA and Cort1-76 (green). All the Western blots used for quantification are shown in Supplementary Fig. 3. Data were fit to a first-order exponential equation (kinetic parameters of the fit listed in the figure) and are reported as mean value ± standard deviation. The statistical significance of the measurements was calculated using an unpaired, two-tailed t-test (P-values listed in the figure). For each data point, P-values for pairwise comparisons with Arp2/3 complex alone (control) are shown from top-to-bottom for experiments with WCA + Cort1-76, WCA, or Cort1-76 (ns, non-significant). The source data are provided as a Source Data file.

