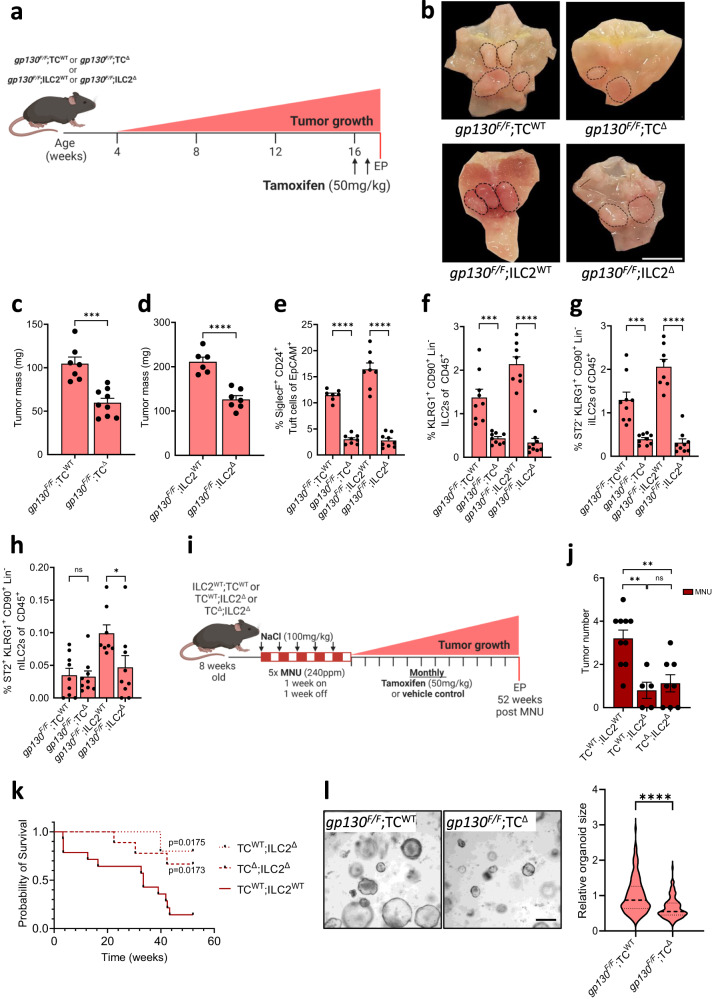
Fig. 2. Genetic ablation of tuft cell reduces gastric adenoma growth.
a Schematic outline of the genetic mouse models used to ablate tuft cells and ILC2s. Tuft cell ablation was achieved in gp130;F/FTCΔ mice and compared against gp130;F/FTCWT littermate controls. Constitutive ILC2 ablation in gp130;F/FILC2Δ mice were compared against gp130;F/FILC2WT littermate controls. All cohorts were given two injections of tamoxifen to induce tuft cell ablation at 16-weeks of age. EP = endpoint. b Representative wholemounts of stomachs of gp130F/F compound mutant mice as described in Fig. 2a. Black dotted circles indicate tumors. Scale bar = 8 mm. c Tumor mass of 17-week-old compound-mutant gp130F/F mice following genetic tuft cell ablation (gp130;F/FTCΔ) compared to Tmx-treated gp130;F/FTCWT. N = 7 and 9 respectively. d Tumor mass of 17-week-old ILC2Δ compared to age matched ILC2WT. N = 6 and 7 respectively. e Flow-cytometry quantification of SiglecF+ CD24+ EpCAM+ tuft cells in tumors of the indicated genotypes treated as described in Fig. 2a. N = 7, 8, 8 and 9 respectively. f Flow-cytometry quantification of ILC2s as KLRG1+CD90.2+Lineage-CD45+ in tumors of the indicated genotypes treated as described in Fig. 2a. N = 9, 9, 8 and 9 respectively. g, h Flow-cytometry quantification of iILC2s and nILC2s in tumors of the indicated genotypes treated as described in Fig. 2a. N = 9, 9, 8 and 9 respectively. i Schematic outline of the MNU/NaCl-induced GC mouse model and experimental mouse strains. TC;ΔILC2Δ, TC;WTILC2Δ, and ILC2;WTTCWT mice were treated with MNU for 5 alternating weeks, then were aged for 52 weeks with monthly tamoxifen injections to ablate tuft cells. EP = endpoint. Created with BioRender.com. j Quantification of tumor numbers in MNU/NaCl-treated mice as described in Fig. 2i. N = 10, 5 and 8 respectively. k Kaplan–Meier survival analysis of MNU/NaCl-treated mice, TC;WTILC2Δ *p = 0.0175 (cp to TC;WT ILC2WT), TC;ΔILC2Δ *p = 0.0173 (cp to TC;WTILC2WT, Mantel-Cox test). N = 14, 5 and 9 respectively. l Representative images and quantification of relative organoid diameter of 10-day old organoids derived from, gp130;F/FTCWT and gp130;F/FTCΔ mice. Scale bar = 300μm. n = 288 and 116 respectively. Data represents mean ± SEM, p values from two-sided Student’s t-test or one-way ANOVA and Tukey’s multiple comparisons tests *p < 0.05, **p < 0.01, ***p < 0.001, ****p < 0.0001, ns - not significant. Each symbol represents an individual mouse. All Data is from two pooled experiments. Source data and exact p values are provided as a Source Data file.

