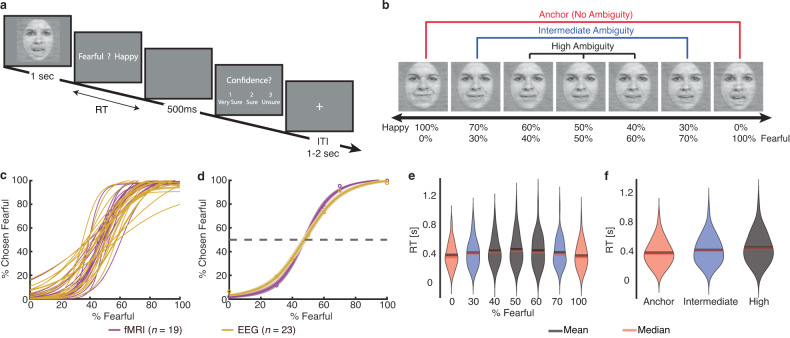
Fig. 1. Behavior.
a Task. A face was presented for 1 s followed by a question asking participants to identify the facial emotion (fearful or happy). For behavioral participants, after a blank screen of 500 ms, they were then asked to indicate their confidence in their decision (1” for “very sure”, “2” for “sure”, “3” for “unsure”). Faces are not shown to scale. b Sample stimuli of one female identity ranging from 100% happy/0% fearful to 0% happy/100% fearful. Three ambiguity levels (unambiguous, intermediate, and high) are grouped as shown above the stimuli. c–f Behavioral results. c Psychometric curves from individual participants showing the proportion of trials judged as fearful as a function of morph levels (ranging from 0% fearful [100% happy; on the left] to 100% fearful [0% happy; on the right]). d Group average of psychometric curves. Shaded area denotes ±SEM across participants. e Reaction time (RT; relative to stimulus onset) for the fear/happy decision as a function of the fearful level. f RT as a function of the ambiguity level. Violin plots present the distribution of RT for combined fMRI and EEG participants (n = 42).

