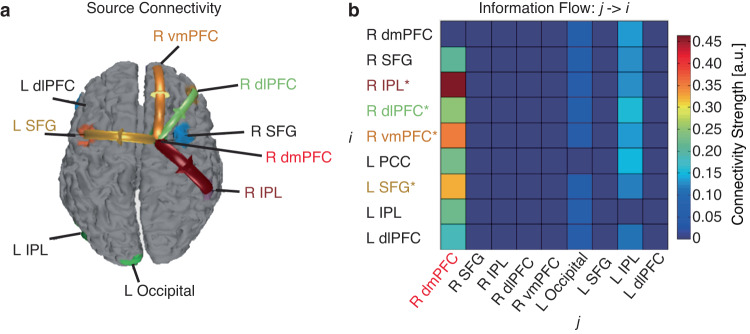
Fig. 5. EEG source connectivity.
a Identified source connectivity. b Connectivity matrix. Color coding in the connectivity matrix indicates the strength of information flow from source j to source i. Asterisks indicate brain regions with a significant directional information flow from the dmPFC (P < 0.05; i.e., brain regions showing a significant connectivity with the dmPFC). L left, R right, dmPFC, dorsomedial prefrontal cortex, SFG superior frontal gyrus, IPL inferior parietal lobule, dlPFC dorsolateral prefrontal cortex, vmPFC ventromedial prefrontal cortex.

