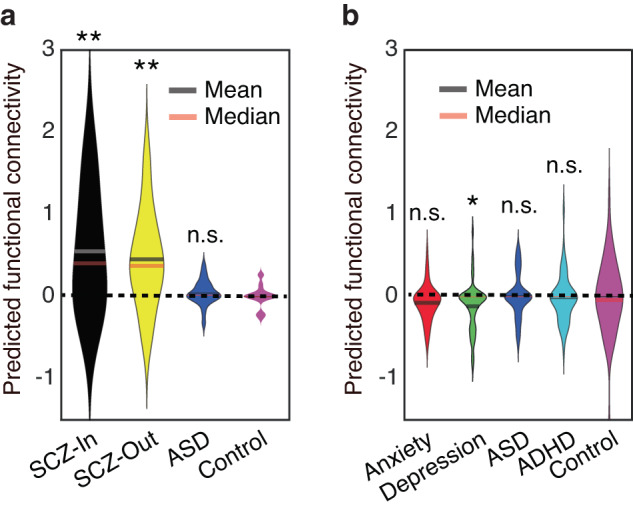
Fig. 7. Predicted functional connectivity.

a In-lab patients with confirmed diagnosis of neuropsychiatric disorders. b Online patients with self-reported neuropsychiatric disorders. Violin plots present the distribution of predicted functional connectivity (normalized by subtracting the mean of the controls). Asterisks indicate a significant difference compared to controls using two-tailed two-sample t-test. *P < 0.05 and **P < 0.01. n.s. not significant.
