Fig. 2.
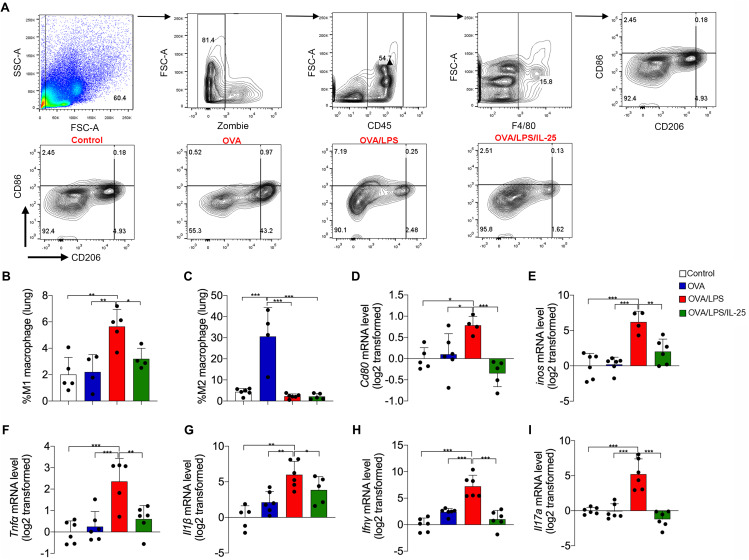
IL-25 inhibited macrophage M1 polarization in a mouse model of neutrophilia-dominant airway inflammation. (A) Flow cytometry of macrophages in mouse lung tissue. The percentages in the leftmost panel represents the proportion of monocytes, the second panel represents the proportion of living cells, the third panel represents the proportion of CD45+ living cells, the fourth panel represents the proportion of F4/80+ cells (macrophages). In the rightmost panel, CD45+F4/80+CD86+CD206- represents M1 macrophage, and CD45+F4/80+CD86-CD206+ represents M2 macrophage; Representative dot plots showing the percentages of M1 and M2 macrophages in different groups. (B) The proportion of M1 macrophages in lung tissue of mice. (C) The proportion of M2 macrophages in lung tissue of mice. (D-F) Detection of Cd80, inos, Tnfα mRNA level in mouse lung tissue using RT-PCR. (G-I) Detection of Il1β, Ifnγ, and Il17a mRNA level in mouse lung tissue using RT-PCR. There were 4–6 mice in each group. One-way ANOVA was used for statistical analysis (* P < 0.05; ** P < 0.01; *** P < 0.001)

