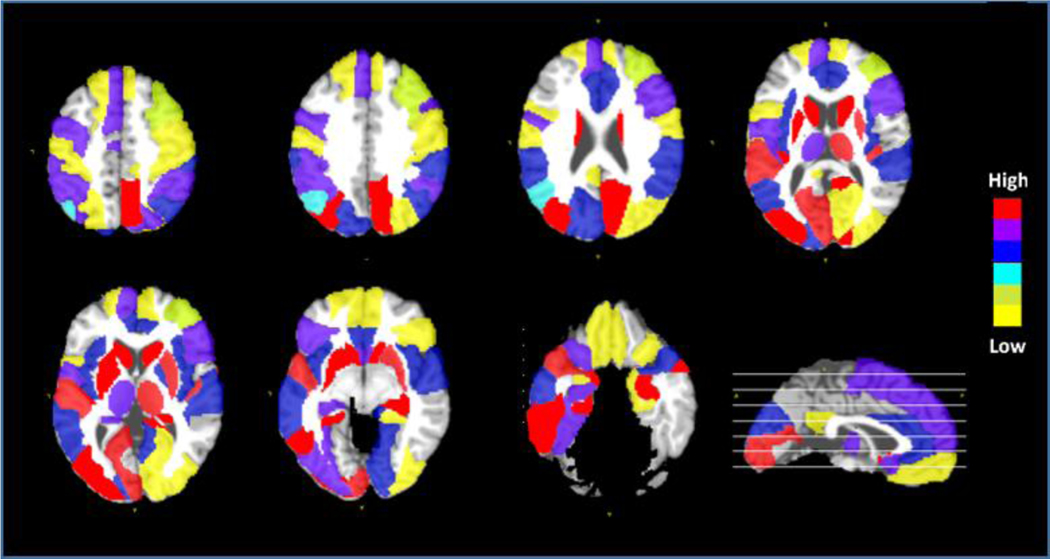
Fig. 9.
The top 20 selected ROIs by the proposed TS-SVM+FS method which are highly involved in early detection of AD progression. We repeat ten In each test, we select top 20 ROIs. This figure shows the frequency of ROIs selected in those ten-fold cross validation. Different color indicates different selection frequency.

