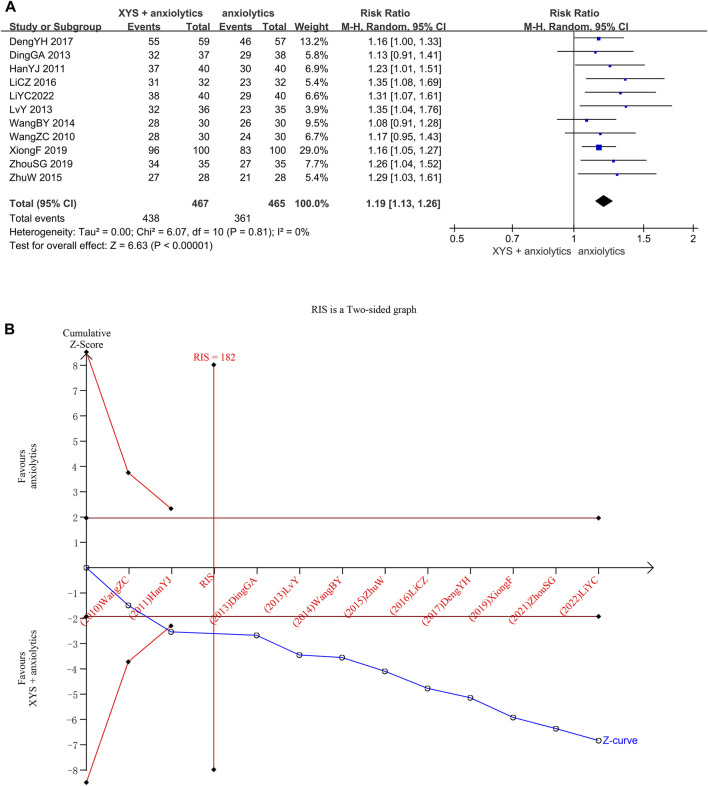
FIGURE 3.
Data analysis of clinical efficacy rates (XYS combined with anxiolytics vs. anxiolytics alone). (A) Meta-analysis. (B) Trial sequential analysis. The blue line represents the cumulative number of cases in the meta-analysis, also called the “Z-curve”. The horizontal straight red line shows the conventional test boundary, which is a traditional significant horizontal line (α = 0.05). The twisted red line represents the trial sequential monitoring boundary, which is an interface curve formed by correcting the random error generated by the meta-analysis. The vertical, straight red line represents the required information size (RIS) and refers to the number of cases required for meta-analysis to obtain statistically significant differences. The cumulative Z-curve surpassed the point of no return and increased to the necessary information size.

