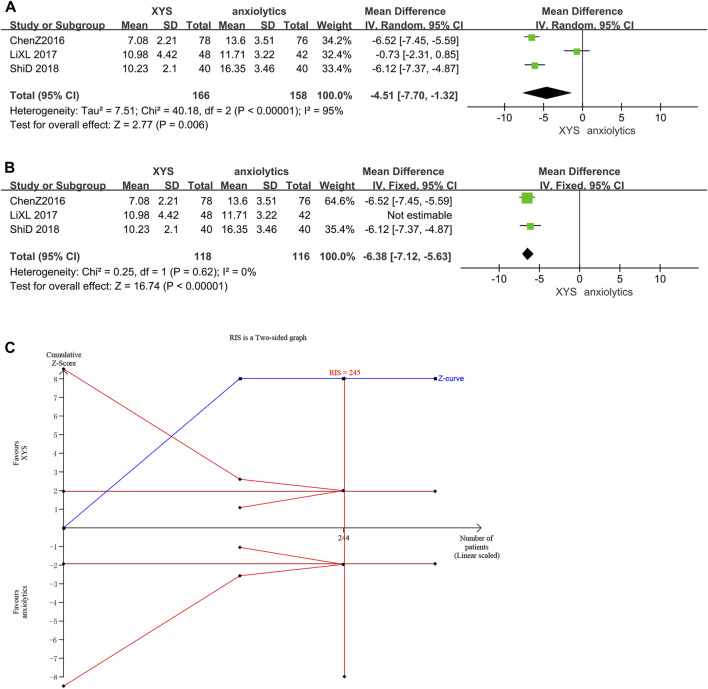
FIGURE 9.
Data analysis of HAMA-14 scores (XYS vs. anxiolytics). (A) Before eliminating sources of heterogeneity. (B) After eliminating sources of heterogeneity. (C) Trial sequential analysis. The annotations of the red line and blue line in TSA are the same as those in Figure 3.

