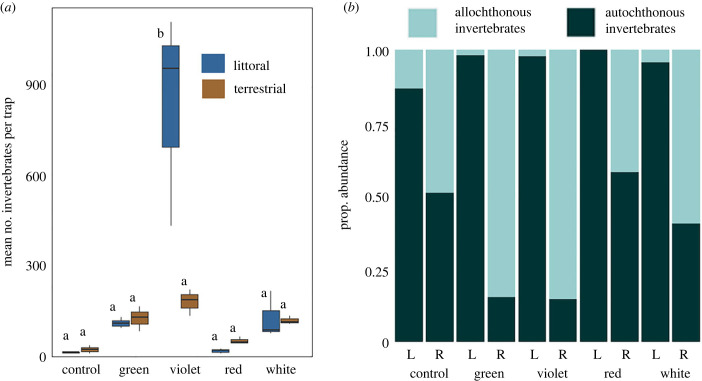
Figure 2.
Invertebrate abundance among colour treatments and between the habitats where invertebrates were collected. (a) Mean number of invertebrates per trap was greater in violet treatments than all other colours (p < 0.001) and greater in the littoral habitat than in the terrestrial habitat (p < 0.01). Littoral habitat is represented by blue bars; riparian habitat is represented by brown bars. Lines represent minimum and maximum values for each treatment. Traps sharing letters are statistically not different based on Tukey post hoc tests. (b) Proportional abundance of allochthonous and autochthonous invertebrates among colour treatments and between habitats, to distinguish the habitat where the organism acquired its biomass. Littoral traps of all colours had greater autochthonous proportional abundance than all white, green and violet riparian traps (p < 0.05). Allochthonous proportional abundance was greater in white, violet and green riparian traps compared to all other treatments (p < 0.05). Bars labelled ‘L’ represent littoral habitat and bars labelled ‘R’ represent riparian habitat. (Online version in colour.)

