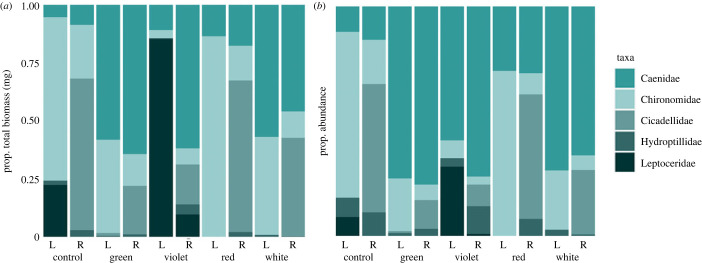
Figure 6.
Proportional total biomass comprised the five most abundant taxa across all treatments (a) and proportional abundance comprised the five most abundant taxa across all treatments (b). Bars labelled ‘L’ represent littoral habitat and bars labelled ‘R’ represent riparian habitat. (Online version in colour.)

