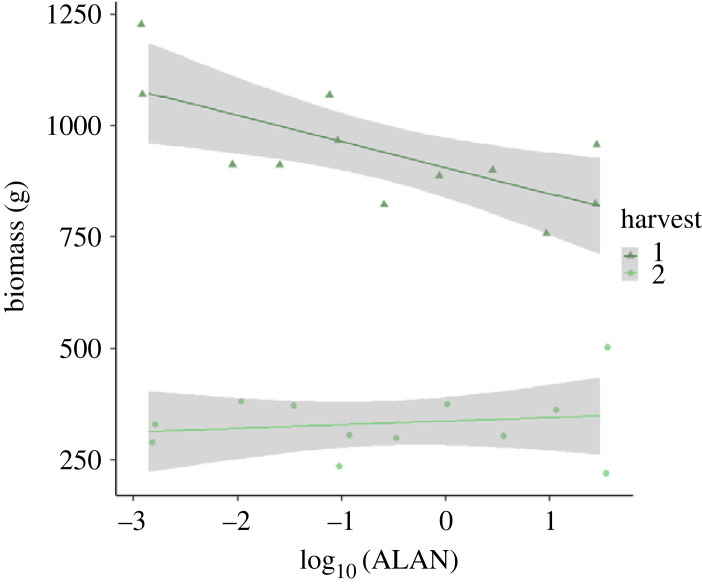
Figure 1.
Biomass (g) of the EcoUnits as dependent on ALAN. Dark green triangles and line represent the biomass values after the first harvest in October; light green points describe the biomass harvest in December. Lines are regression lines; the errors of the parameters are depicted as grey bands.

