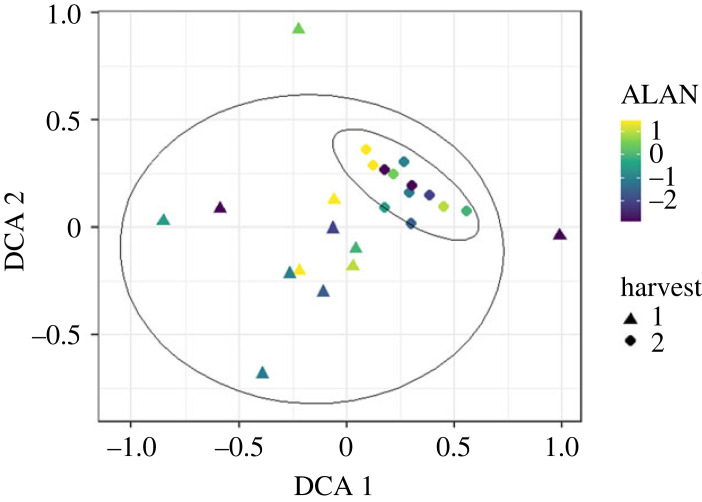
Figure 3.
Detrended correspondence analysis (DCA) of the species-specific biomasses in each EcoUnit and between the two harvests. Light intensity of ALAN is colour-coded ranging from low light intensities (purple) to high light intensities (yellow) of ALAN. The two harvests are displayed with different symbols: the October harvest is displayed as triangles; the December harvest is displayed as circles. The Eigenvalue of DCA 1 was 0.27, the Eigenvalue of DCA 1 was 0.14. Ellipses show 95% confidence interval for each sample date.

