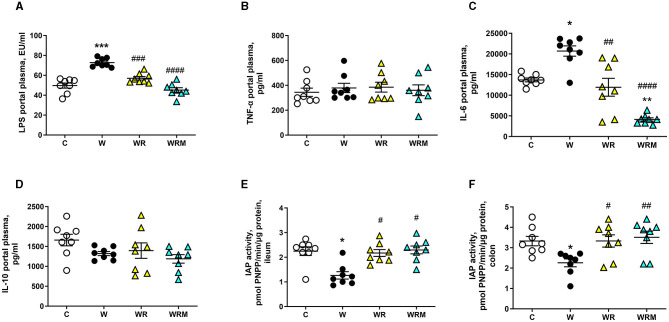
Figure 4.
Portal plasma levels of lipopolysaccharides (LPS) (A), TNF-α (B), IL-6 (C), and IL-10 (D) and intestinal alkaline phosphatase (IAP) (E, F). Values are expressed as the means ± SEM of eight rats. *P < 0.05, **P < 0.01, ***P < 0.001 compared to (C); #P < 0.05, ##P < 0.01, ###P < 0.001, ####P < 0.0001 compared to W (one-way ANOVA followed by Bonferroni post-test).

