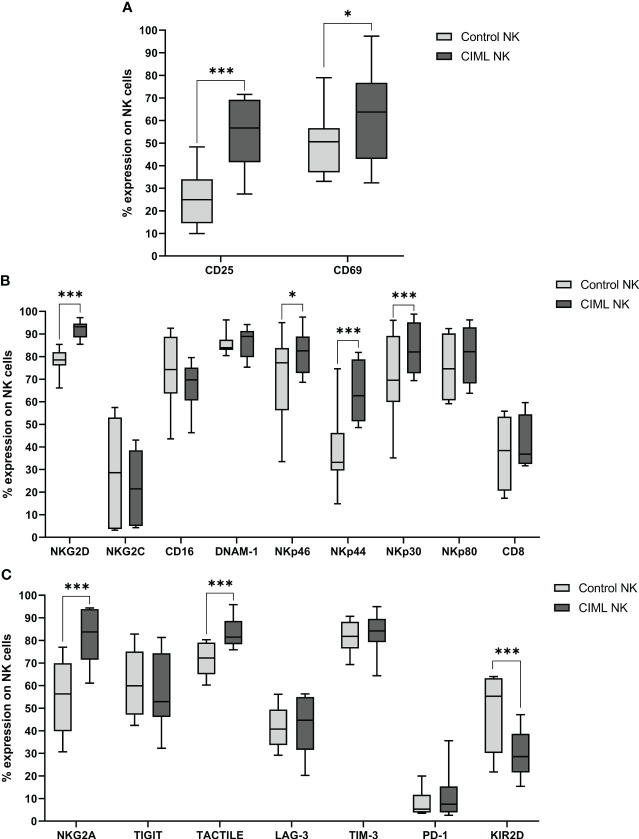
Figure 1.
Phenotypic analysis of CIML and control NK cells after 7 days of culture. (A) Expression of the activating markers CD25 and CD69. (B) Expression of NK cell activating receptors and CD8. (C) Expression of NK cell inhibitory receptors. p-values were calculated by using the non-parametric Friedman test, followed by pairwise comparisons (Durbin-Conover test), * p ≤ 0,05, *** p ≤ 0,001.

