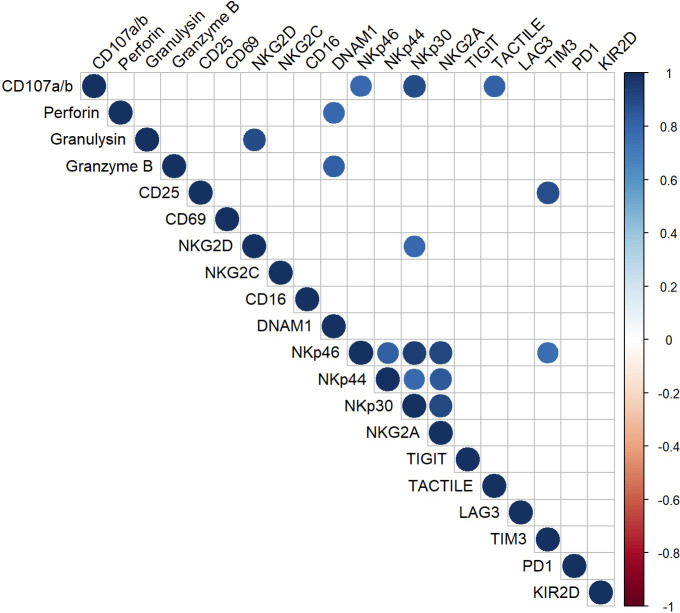
Figure 6.
Multiple correlation analysis of CIML NK cells after 7 days of culture. The Pearson correlation coefficient was used to determine multiple correlations. The color and size of the circles in the graph correspond to the obtained r-value; only significant correlations (p ≤ 0.05) are displayed in the graph.

