Figure 1.
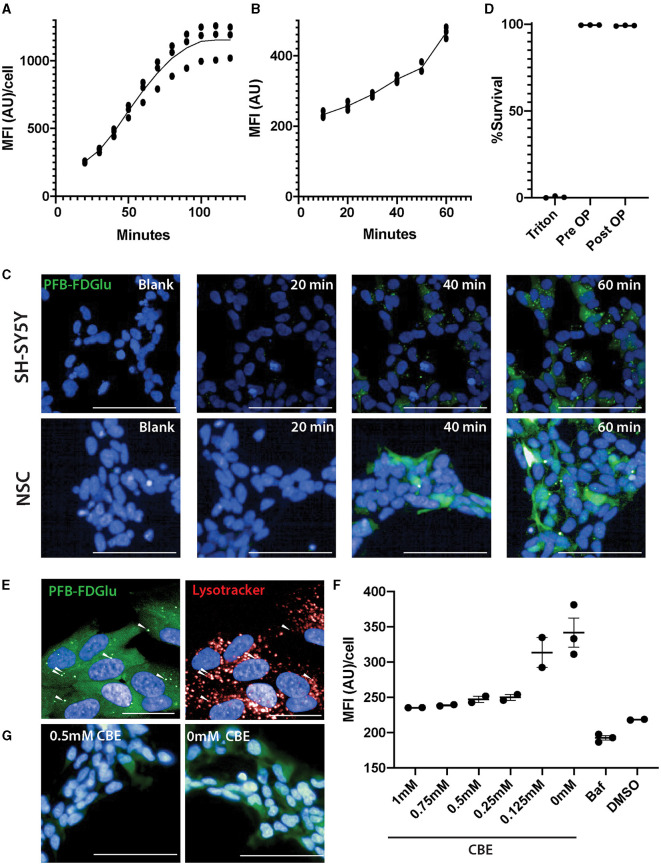
Optimization of GCase live cell assay in SH-SY5Y and neural stem cells (NSCs). (A) Fluorescence from the metabolism of the GCase substrate PFB-FDGlu was measured every 10 min for 2 h in SH-SY5Y cells and for 1 h in NSCs from a control line (B). (C) Representative images of the PFD-FBGlu fluorescence of blank (no PFB-FDGlu treated, representative image at 60 min) and treated wells at 20, 40, and 60 min in SHSY5Y (top row of images) and NSCs (lower row of images). (D) Cell viability measurement based on lactate dehydrogenase release before and after 2 h of imaging inside the Opera Phenix. (E) Representative images of the colocalization of PFB-FDGlu fluorescence puncta with Lysotracker puncta and diffuse PFB-FDGlu cytoplasmic staining. (F) CBE dose-dependent response and bafilomycin treatment on the effect of PFB-FDGlu fluorescence with horizontal bars representing the mean of each condition. (G) Representative images of the PFB-FDGlu fluorescence of 0.5 and 0 mM CBE at 45 min. (G) Representative images of the colocalization of PFB-FDGlu fluorescence puncta with Lysotracker puncta and diffuse cytoplasmic staining. Dots on graphs represent the MFI/cell on an independent well (n = 2–3); white scale bar for (D, F) = 100 μm; white scale bar for (G) = 25 μm. MFI/cell, mean fluorescence intensity per cell, represented in arbitrary units. Results are representative of at least 2 independent experiments.

