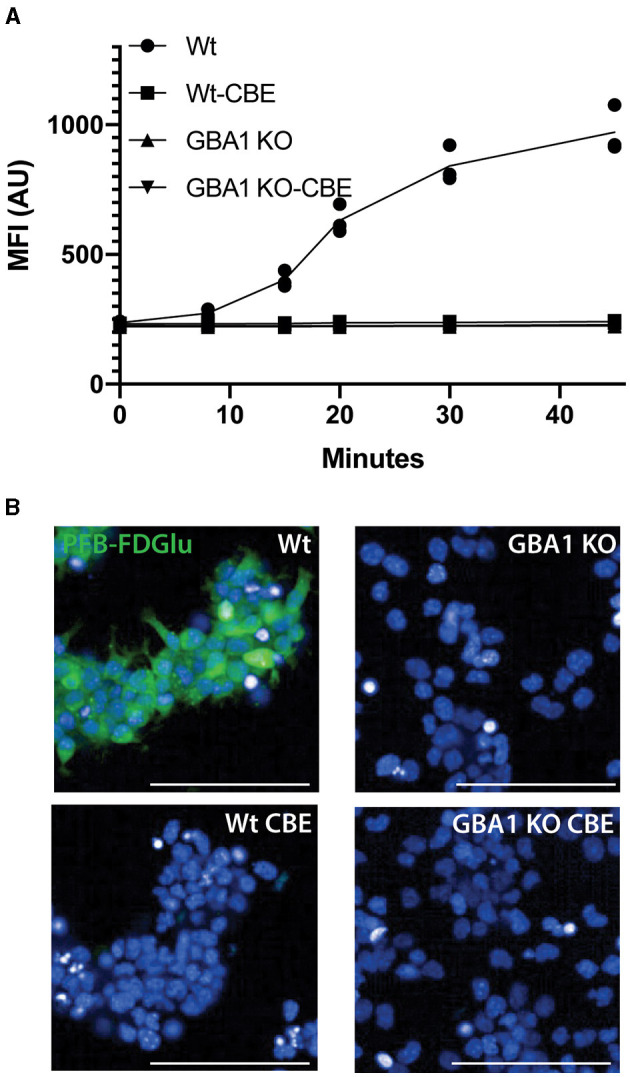
Figure 2.

GCase live cell assay validation in GBA1 KO cell line. (A) PFB-FDGlu fluorescence was measured over time in Wt and GBA1 KO neural cell lines in the presence or absence of CBE. (B) Representative images of the PFB-FDGlu fluorescence at 45 min in wildtype and GBA1 KO cell lines without CBE. Each dot represents the MFI/cell on an independent well (n = 3); white scale bar = 100μm; MFI/cell, mean fluorescence intensity per cell, represented in arbitrary units.
