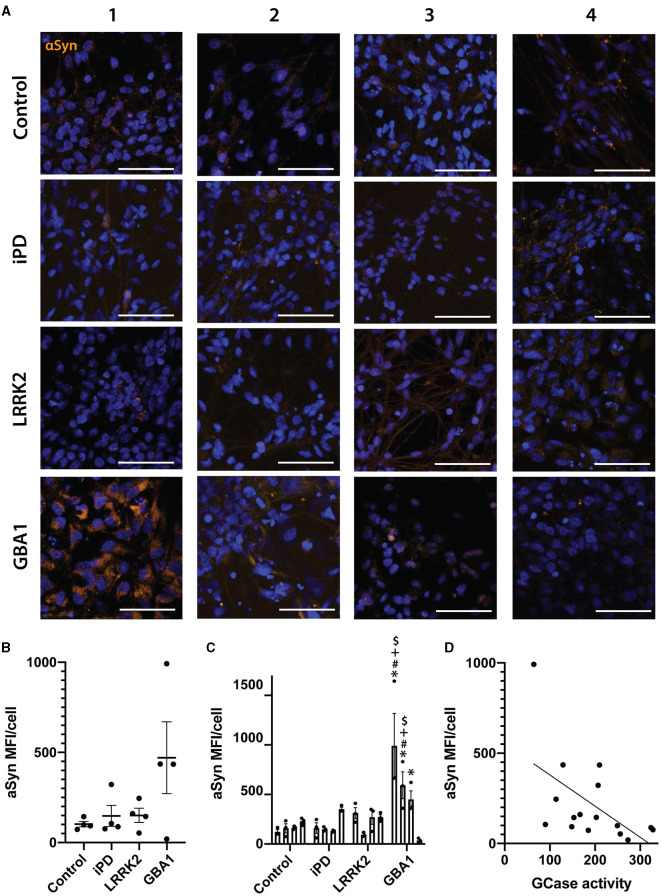
Figure 5.
Alpha-synuclein levels in differentiated neurons correlate with their GCase activity ratio. (A) Representative images of alpha-synuclein immunofluorescence staining in 16 neuronal differentiated cell lines. Each row represents an experimental group (see image left labels), and each column represents individual 1–4 of each experimental group. (B) Alpha-synuclein MFI/cell of 16 neuronal differentiated cell lines grouped by experimental group, each dot represents the MFI/cell of each cell line, calculated as the mean of 3 independent experiments, each horizontal line represents the mean of the group, the error bars represent ± the SEM. (C) Individual alpha-synuclein MFI/cell of all 16 neuronal differentiated cell lines, each bar represents the mean MFI/cell of 3 independent experiments (represented as individual dots), and the error bars represent ± the SEM. (D) Spearman correlation graph between GCase activity ratio vs. alpha-synuclein MFI/cell for all 16 neuronal differentiated cell lines. Each value for the X axis represents the mean of the GCase activity ratio in differentiated neurons of 3 independent experiments, and each value for the Y axis represents the mean of the alpha-synuclein MFI/cell in differentiated neurons of 3 independent experiments. One-way ANOVA with Bonferroni post-hoc testing and adjusted p-values for multiple comparisons was used to compare effects between groups or individual cell lines *White scale bar = 100 μm. *p < 0.05 compared to Control-1 line, #p < 0.05 compared to Control-2 line, +p < 0.05 compared to Control-3 line, $p < 0.05 compared to Control-4 line.

