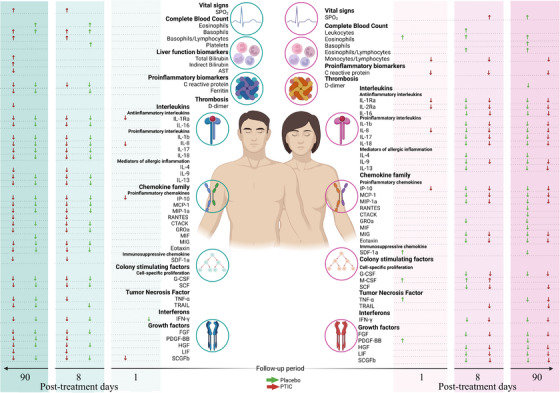
FIGURE 1.

Significant relative physiological variables on days 1, 8 and 90 post‐treatment, distinguishing between men (left‐hand side) and women (right‐hand side) and also distinguishing between the placebo group (green‐coloured arrows) and the PTIC treatment group (red‐coloured arrows). Shown are changes in magnitude for each variable compared with the baseline (increases represented by upwards arrows and decreases by downwards arrows). PTIC, Polymerised type I collagen.
