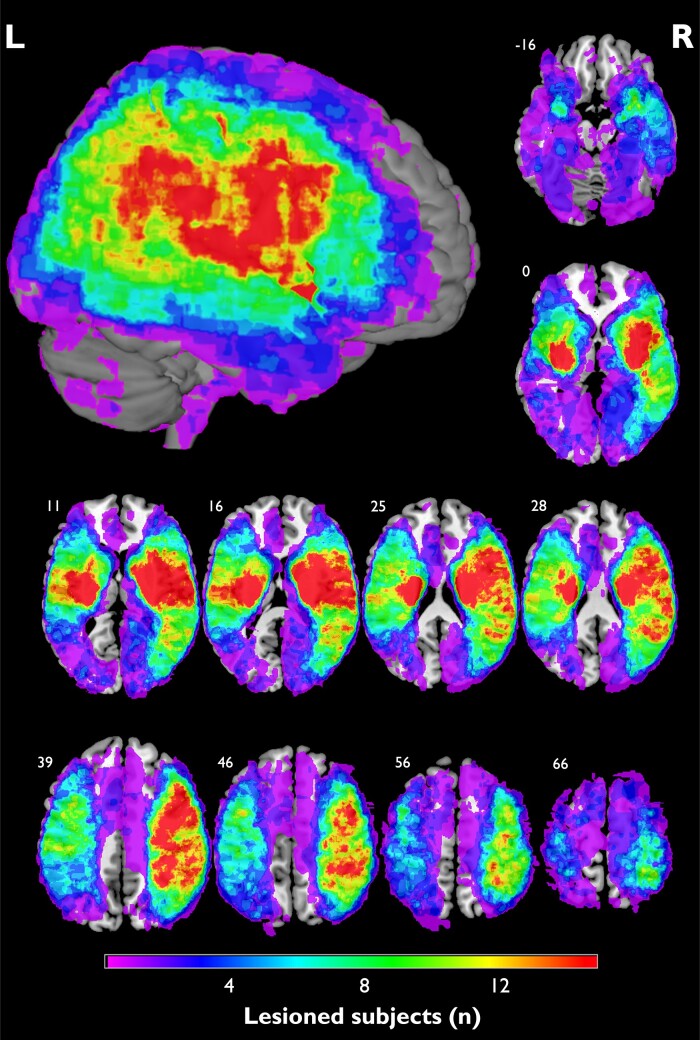
Figure 1.
Lesion coverage map. Overlap map of normalized lesions from patients included in the analysis (n = 200). Coordinates indicate the corresponding z-value in the Montreal Neurological Institute space. Colours indicate the amount of lesion overlap. The highest overlap was seen at the right putamen (n = 41). Please note that small overlap into ventricles is due to co-registration for display purposes in MRIcron. L, left; R, right.

