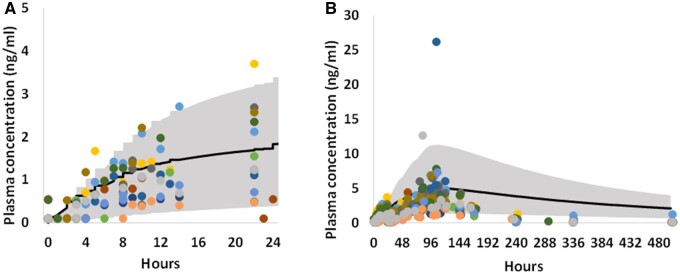
Figure 6.
For octocrylene, comparison between observed (dots, different color represents different subject data) (Matta et al., 2020) and PBK simulated (solid curve, mean) plasma concentration time profiles, for day 1 (A) and the entire study duration (B, 21 days) after dermal application of a lotion sunscreen product containing 6% octocrylene. The study product was applied 1 time on day 1 (0 h) and 4 times per day for the remaining 3 days. The shaded area represents the 90th percentiles interval of human population simulation.

