
Fig. (2).
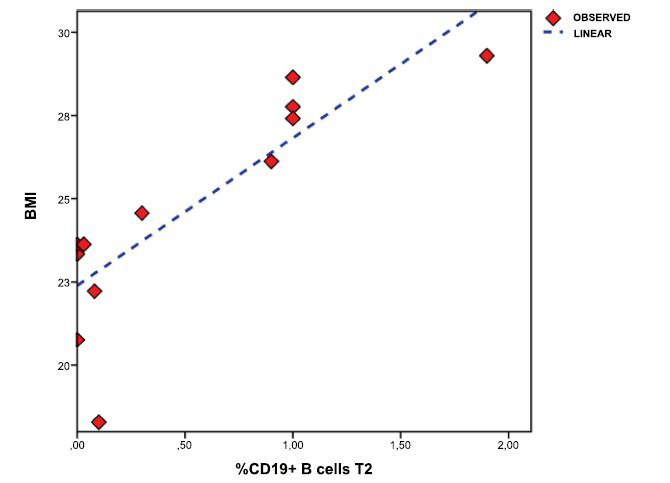
Linear regression analysis plot between CD19+ B cells (B-naïve) (time 2) and BMI values. BMI, body mass index.
Official websites use .gov
A
.gov website belongs to an official
government organization in the United States.
Secure .gov websites use HTTPS
A lock (
) or https:// means you've safely
connected to the .gov website. Share sensitive
information only on official, secure websites.
Linear regression analysis plot between CD19+ B cells (B-naïve) (time 2) and BMI values. BMI, body mass index.