Figure 3.
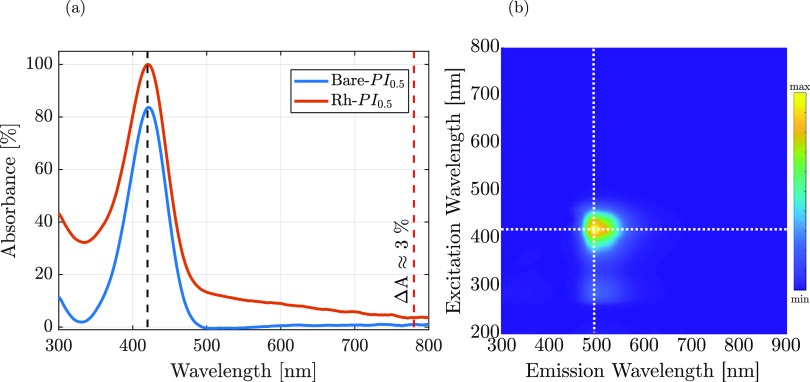
(a) UV–vis absorption spectra of Bare- and Rh–PI0.5 resists. The black dashed line highlights the PI absorption peak; the red dashed line evidence the relative absorbance variation (ΔA) between the Rh-incorporated and bare photoresist. The Bare-PI0.5 is used as the control. (b) 2D photoluminescence (PL) spectrum of the Rh–PI0.5 photoresist, highlighting the excitation and emission peaks with white dashed lines.

