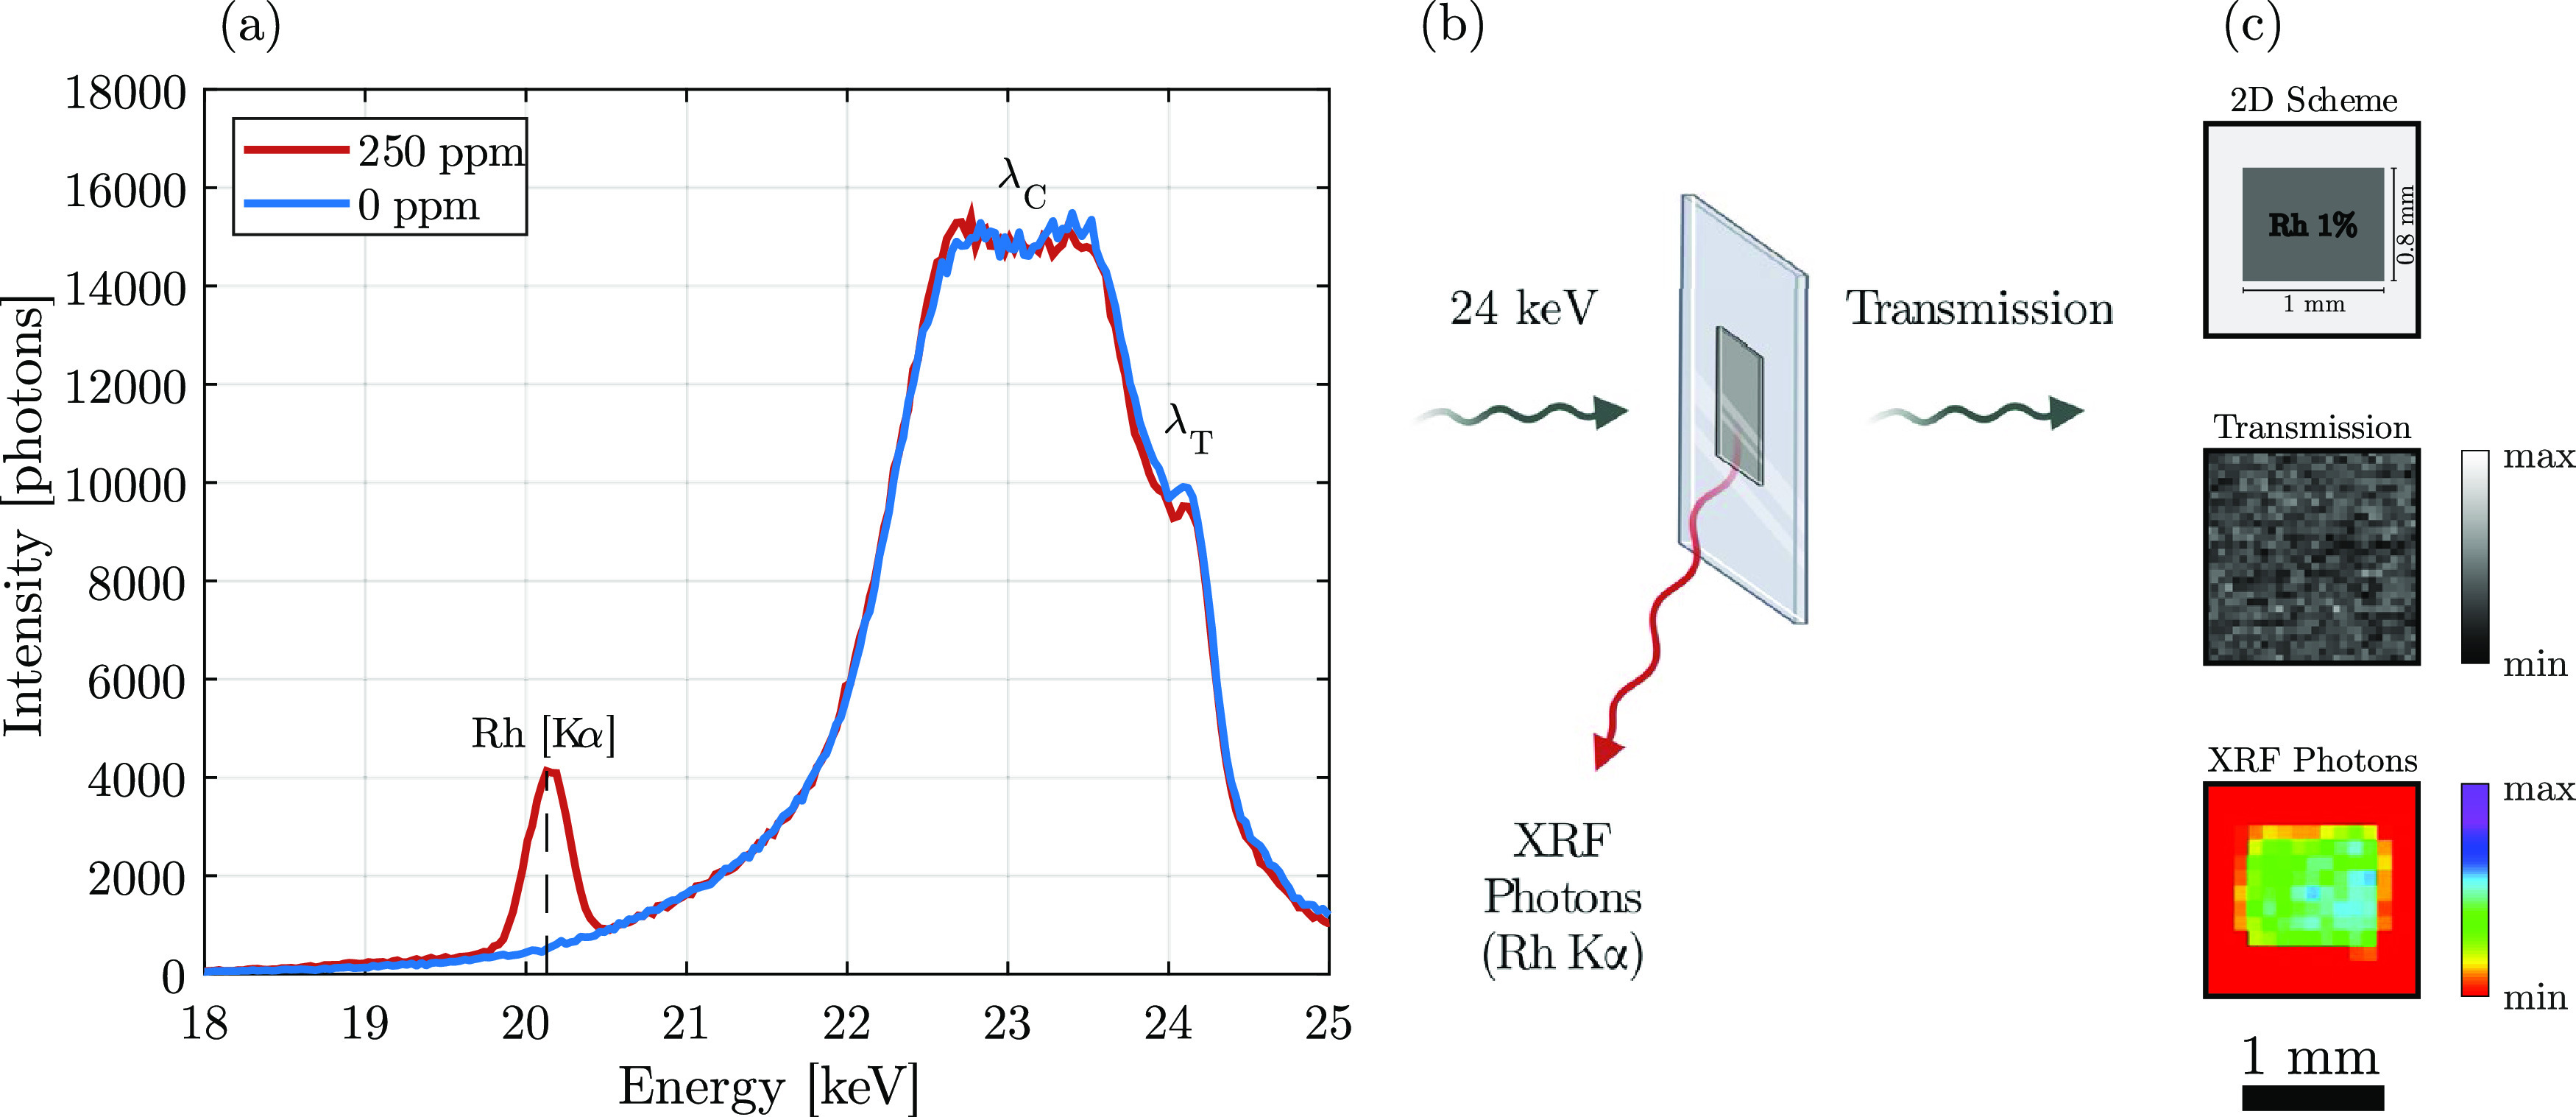
Figure 7.

(a) X-ray fluorescence (XRF) spectrum recorded for a vial containing Rh NPs dispersed in a solution (red) compared to the control (blue). (b) Schematic representation of the XRF imaging setup. (c) 2D scheme and projection images (transmission vs XRF) of a thin 2PP-printed film using the Rh–PI0.5 resin.
