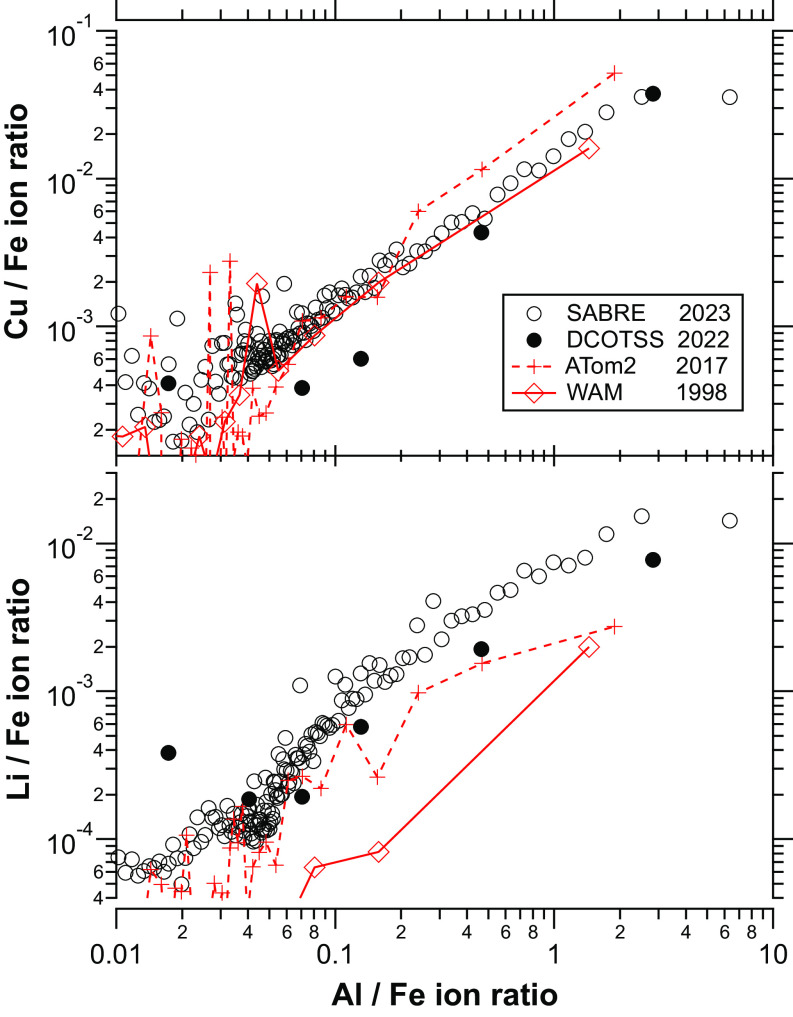
Fig. 3.
Copper and lithium ion ratios to iron relative to the aluminum to iron ratio. Each point is the average of the ratios from 1,000 (SABRE) or 150 (other missions) mass spectra after sorting the mass spectra by the Al/Fe ion ratio. The scatter in the data at Cu/Fe ratios less than 0.001 is due to small interferences for 63Cu such as organic fragment ions.

