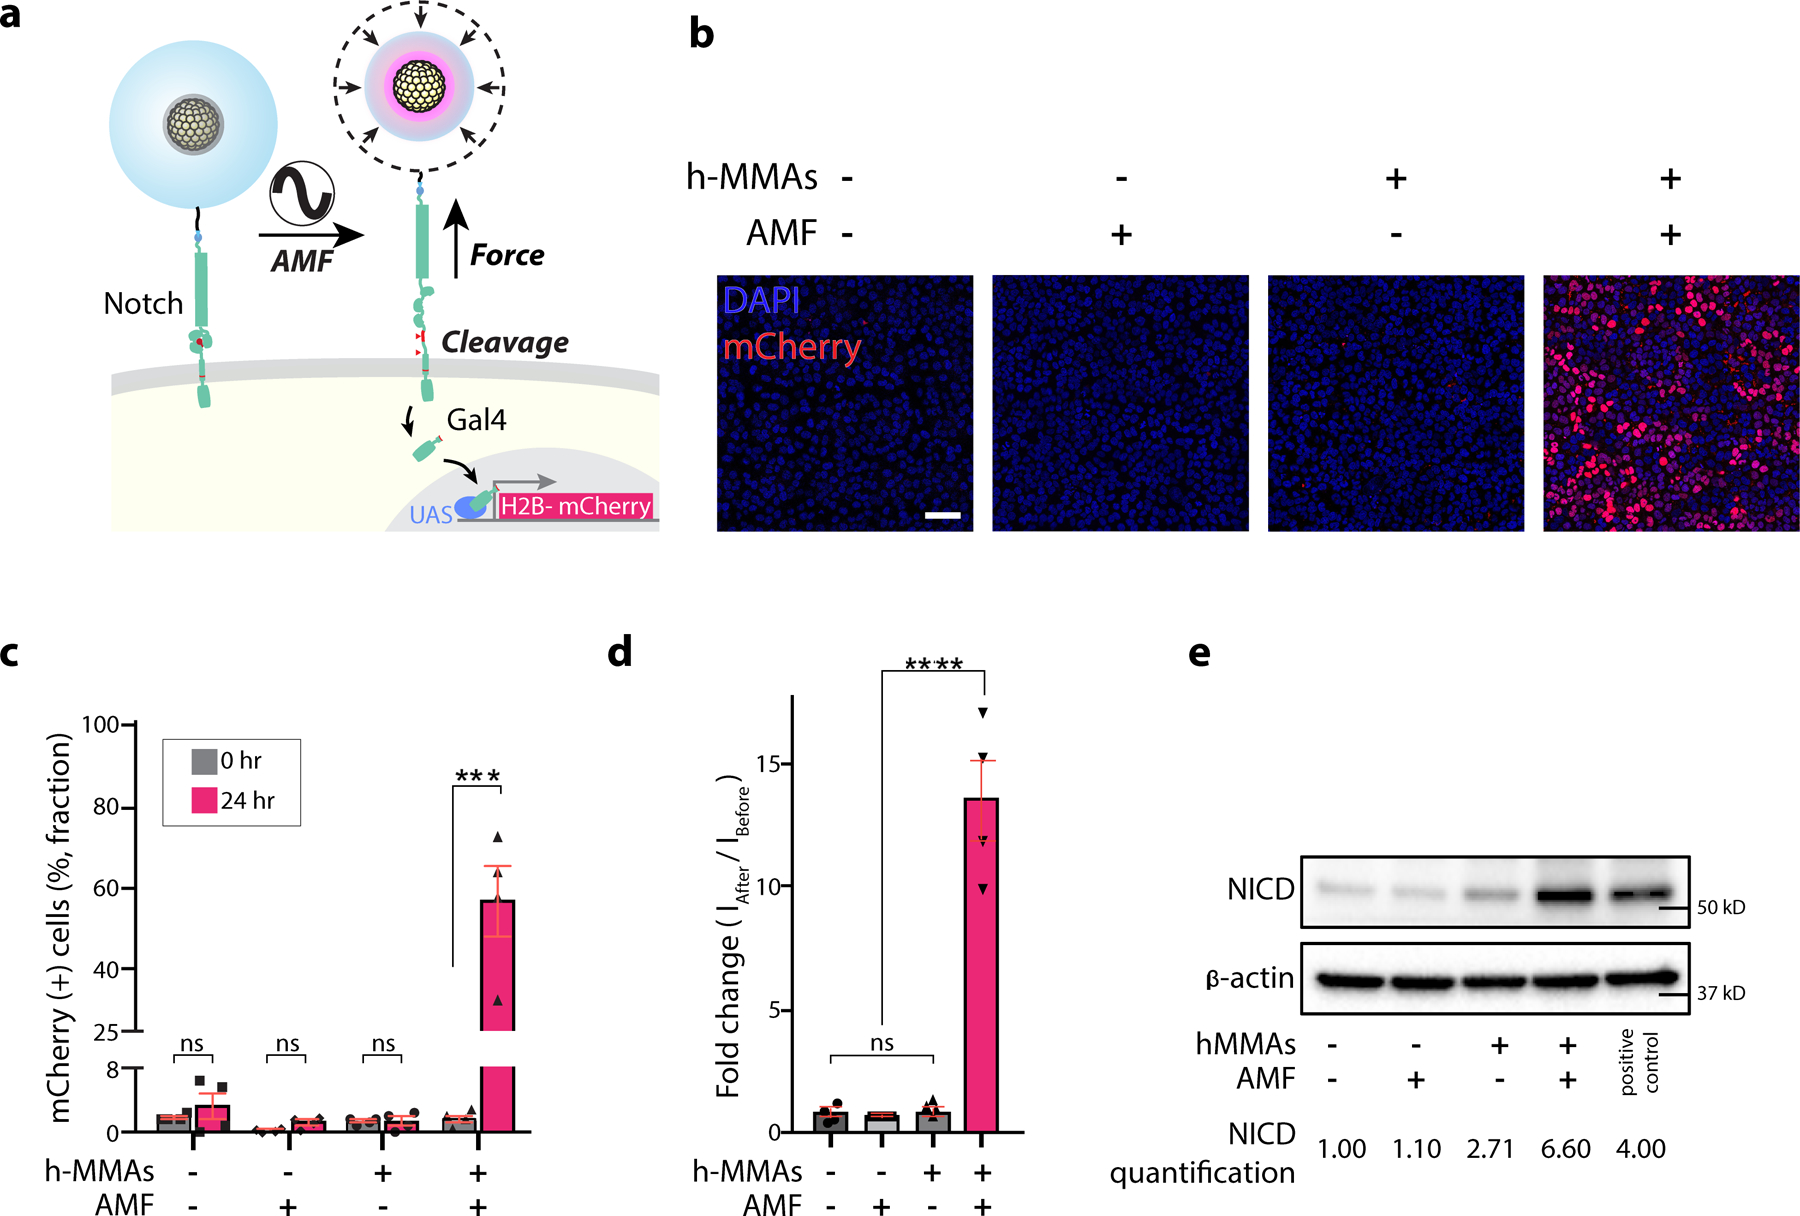
Figure 3. AMF-induced activation of Notch signaling in a cell line model using h-MMA nanoparticles.

(a) A schematic illustration of h-MMAs induced activation of U2OS reporter cells expressing SNAP-Notch1-Gal4 and H2B-mCherry. h-MMAs specifically label Notch1 receptors via SNAP-benzylguanine (BG) chemistry. AMF stimulation (50 kHz at 500 Oe, 30 s ON / 2 min OFF cycle for 15 times) induced VPT and exerted mechanical force to Notch1. Mechanical stimulation of Notch1 triggers enzymatic cleavages of Notch1 and downstream transcription of H2B-mCherry. (b) Representative confocal fluorescence images of the reporter cells treated with h-MMA nanoparticles and AMF. Cells treated with no h-MMA or AMF were used as controls. Scale bar = 100 µm. (c) Percentage of the mCherry-positive cells with or without AMF stimulation or h-MMA treatment. Fluorescence-positive fractions were measured at (0 hr) and 24-hr post stimulation. Data are mean ± SD from n = 4 biological replicates (ns, non-significant; ***p < 0.001; two-tailed Student’s t-test). (d) Normalized fold-change in mCherry fluorescence signal observed at 24-hr post-AMF stimulation as compared to the baseline level for respective experimental conditions. Data are mean ± SD from n = 4 biological replicates (ns, non-significant; ****p < 0.0001; two-tailed Student’s t-test). (e) Immunoblot analysis of cleaved Notch intracellular domain (NICD). β-actin levels represent the loading control. The number below the gel images indicates the relative NICD band intensity. The intensity of each NICD band relative to the respective β-actin band was quantified and normalized to that of the control groups treated with no h-MMAs or AMF.
