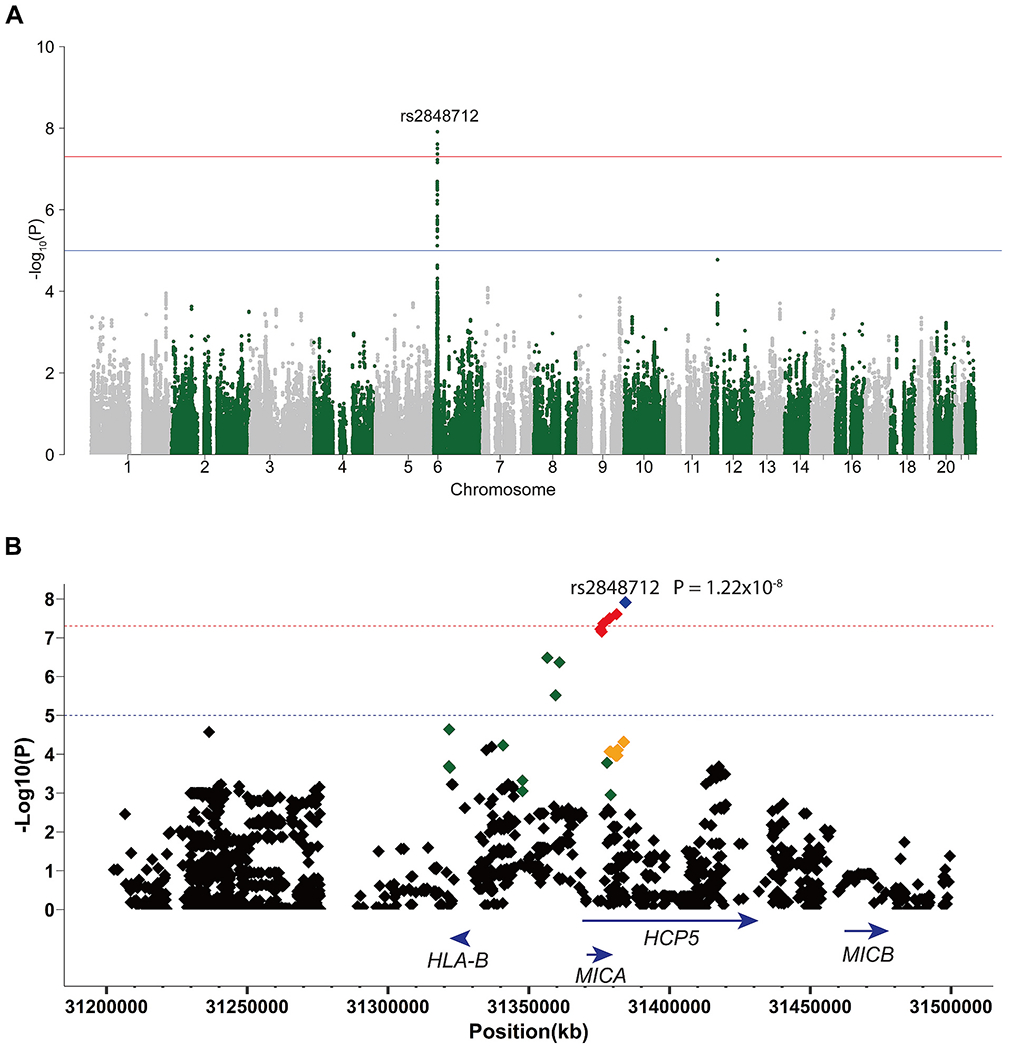
Fig. 1.

(A) A Manhattan plot showing the results of the case-case genetic association analysis of male and female patients with Behcet’s disease of Turkish origin. The −Log10(P) value for each variant is plotted against its chromosomal position. The red line represents the genome-wide level of significance (P < 5 × 10⁻⁸) and the blue line represents the suggestive level of significance (P < 1 × 10⁻⁵). (B) Regional plot displaying SNPs in LD with rs2848712 in the HLA region in the Turkish population (LD = 1 is blue, LD = 0.99–0.80 is red, LD = 0.79–0.60 is orange, LD = 0.59–0.40 is green, and LD = 0.39–0.00 is black). The −Log10(P) value for each variant is plotted against its physical position on chromosome 6. The red line represents GWAS level of significance (P < 5 × 10⁻⁸) and the blue line represents suggestive level of significance (P < 1 × 10⁻⁵). (Assembly_GRCh37/hg19 by Ensembl was used).
