
Fig. 3.
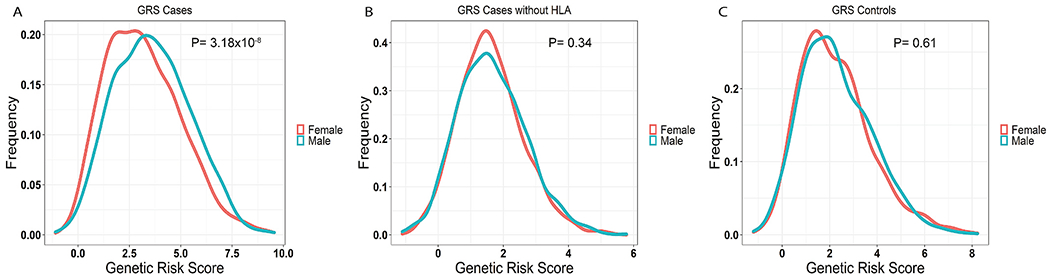
(A) Density plot of genetic risk scores (GRS) for Behçet’s disease in Turkish patients. The frequencies of individuals are plotted against their respective GRS (men in blue and women in red), showing higher genetic risk in men than women (P = 3.18 × 10⁻⁸). (B) Density plot of GRS in Turkish patients with Behçet’s disease without the SNPs in the HLA region (men in blue and women in red). The difference between men and women disappears (P = 0.34). (C) Density plot of GRS in healthy Turkish controls (men in blue and women in red) displaying no significant difference between men and women (P = 0.61).