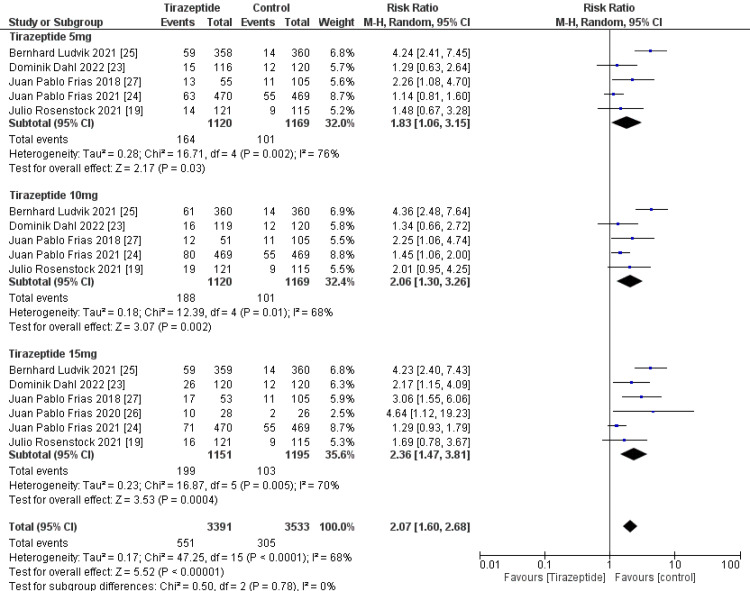
Figure 8. Forest plot showing the risk ratios of the incidence rate of diarrhea using random-effects models.
A vertical line, “no difference” point between the two groups; horizontal line, 95% confidence interval; squares, risk ratios; diamonds, pooled risk ratios.
CI, confidence interval; MH, Mantel-Haenszel.

