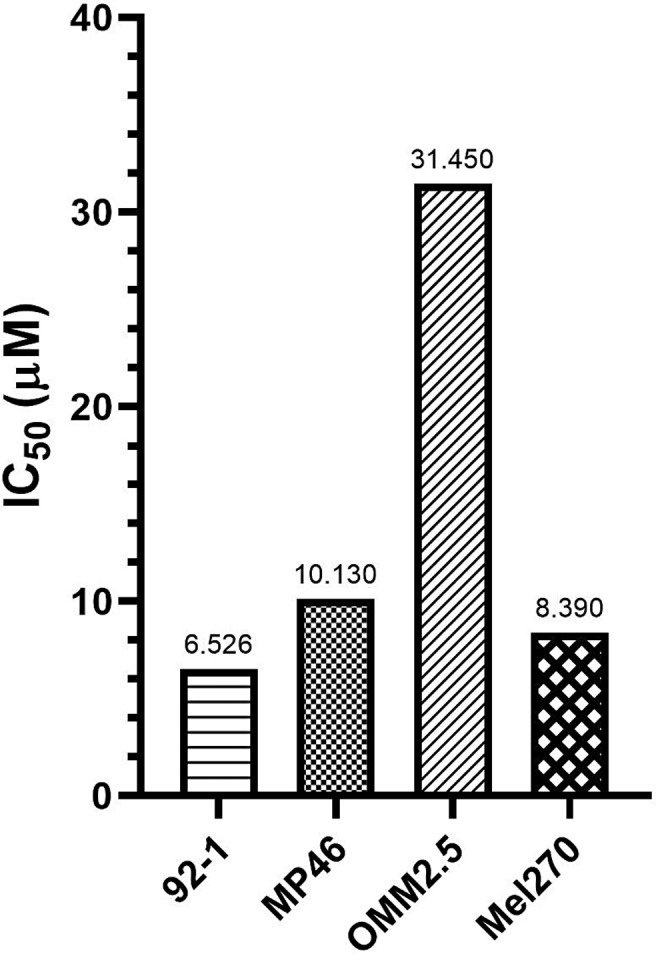
Fig. 6.

Graph of the IC50 values of dorsomorphin. Bar graph shows the IC50 values of dorsomorphin; hence, its cytotoxic effects, in a variety of UM cell lines after 48 h treatment. IC50 values were estimated by fitting models with nonlinear regression. UM, uveal melanoma.
