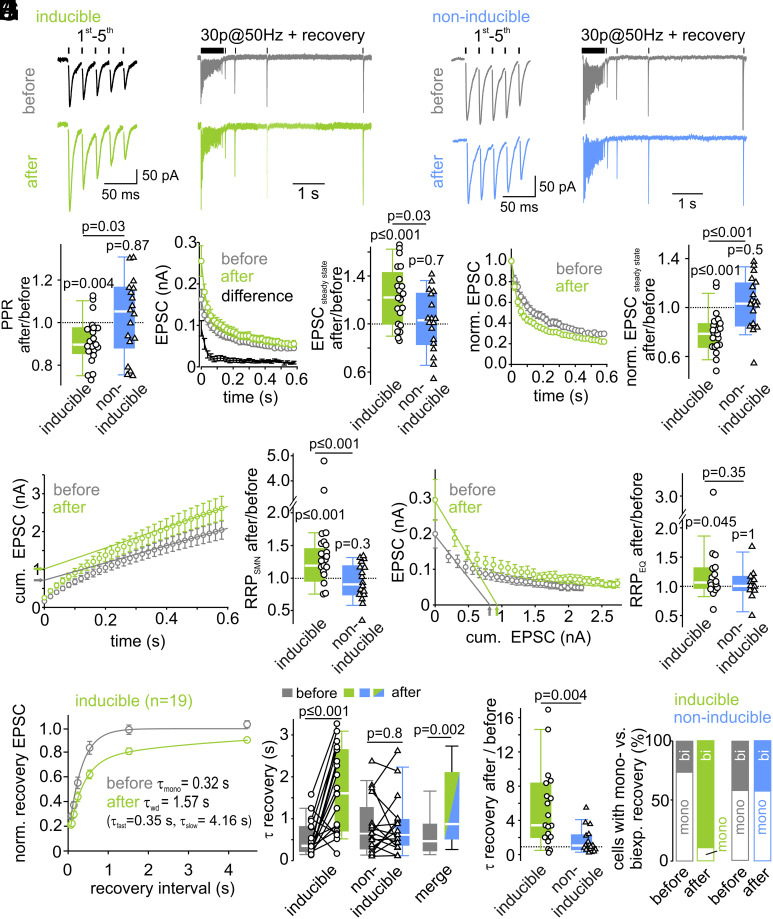
Fig. 2.
LTP changes short-term plasticity, increases the number of readily releasable vesicles, and slows the recovery from synaptic short-term depression. (A and B) Example average traces of the first 5 EPSCs (Left) of a 50-Hz-EPSC train (Right), followed by EPSCs elicited by single stimuli at different interstimulus intervals to probe recovery from short-term depression, recorded before (Top, gray) and after (Bottom, green or blue) LTP induction in inducible (A) and in non-inducible (B) connections. (C) Individual and median relative changes in PPR after LTP induction in inducible and non-inducible connections. (D) Mean EPSC amplitudes during 50-Hz-trains were increased after LTP induction in inducible connections (Left). The difference curve indicates an increased synaptic strength throughout the train with a higher potentiation for the first EPSCs in inducible connections. (Right) Relative changes of steady-state EPSC amplitudes after LTP induction in both inducible and non-inducible connections. (E) Mean normalized high-frequency EPSCs exhibit short-term depression, which increased in inducible connections after LTP induction. (F) RRP size estimation by back-extrapolation of a linear fit to the last five amplitudes of the cumulative EPSC train plotted as a function of stimulus time (SNM method) shows an increase in inducible connections (Left). Relative changes of RRP size after LTP induction for inducible and non-inducible connections are shown in the Right panel. (G) RRP size estimation by forward-extrapolation of a linear fit to the first three amplitudes of the EPSC train plotted as a function of cumulative previous release (EQ method) also shows an increase after LTP induction in inducible connections. Relative changes of RRP size after LTP induction for inducible and non-inducible connections are shown in the Right panel. (H) Mean normalized EPSCs during recovery from short-term depression plotted as a function of recovery interval reveal a slower recovery from synaptic short-term depression after LTP induction in inducible connections. The time constants of recovery from short-term depression were calculated from either mono- or biexponential fits to the mean recovery time course (lines). (I) Comparison of individual and median absolute (Left) and summary plot of relative changes (Right) of the weighted recovery time constant reveals a slowing of recovery from short-term depression after LTP induction in inducible (n = 19) but not in non-inducible connections (n = 17). (J) Proportion of cells (in %) with a mono- or biexponential recovery before and after LTP induction in inducible and non-inducible connections. Before LTP induction, a majority of the inducible connections exhibits a monoexponential recovery time course. After LTP induction, nearly all inducible connections exhibit a biexponential recovery from short-term depression.

